
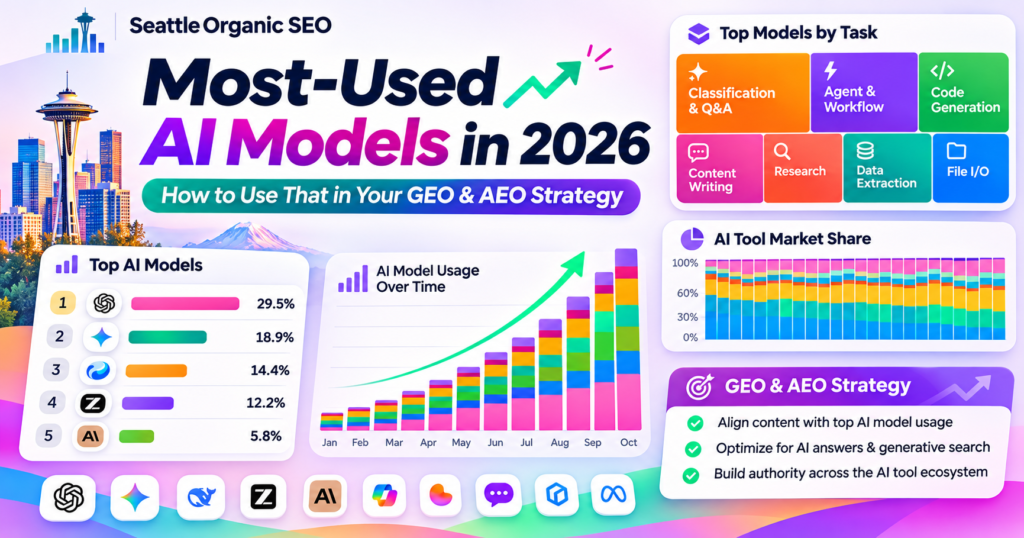
Updated October 31, 2026. ChatGPT leads standalone AI assistants in measured web traffic, but DeepSeek and other high-throughput models can lead in API tokens. AI users are not all doing the same things, and businesses optimizing for generative engine optimization (GEO) and answer engine optimization (AEO) cannot treat every model as equally important.
A local business needs visibility where customers compare providers and make purchasing decisions—not simply where a coding agent generates the most tokens. Our analysis separates web sessions, underlying API usage, model-request share, task spending, specialized AI functions, and private enterprise consumption.
Five ways to understand AI usage
| Measurement | What it captures | What it misses |
|---|---|---|
| Website visits | Browser sessions to AI websites | Native app, enterprise, API and embedded use |
| Active users | People active during a provider-defined period | Usage frequency and intent |
| Token volume | Text processed by an API/model | Number of people, referrals, quality |
| Request share | Share of calls to models/providers | Time spent or business conversions |
| Task spending | Money spent on classified work | Time spent on tasks or domains |
1. Most-used consumer AI assistants
In the Similarweb-based September 2026 comparison published by Visual Capitalist, ChatGPT received approximately 5.90 billion visits, followed by Gemini at 2.62 billion and Claude at 1.00 billion. These are website traffic estimates, not global AI user counts.
| AI Assistant | Estimated September visits | Share of tracked chatbot web visits |
|---|---|---|
| ChatGPT | 5.90B | 56.4% |
| Gemini | 2.62B | 25.0% |
| Claude | 1.00B | 9.6% |
| DeepSeek | 356M | 3.4% |
| Grok | 241M | 2.3% |
| Microsoft Copilot | 157M | 1.5% |
| Perplexity | ~94M | 0.9% |
ChatGPT plus Gemini account for about 81.4% of visits in that specific tracked set. Do not interpret this as 81.4% of all AI queries, purchases, apps or enterprise deployments.
2. Top 50 AI Chatbots & Tools
Unlike the seven-chatbot comparison, the category includes AI development tools, entertainment products, vendors’ corporate sites, and AI-powered productivity applications. This is a website ranking, not a model ranking and comes from SimilarWeb.
| Rank | Website | Avg. visit duration | Pages / visit | Bounce rate |
|---|---|---|---|---|
| 1 | 06:43 | 4.75 | 24.86% | |
| 2 | 06:30 | 4.21 | 27.25% | |
| 3 | 05:57 | 4.17 | 27.98% | |
| 4 | 05:22 | 3.22 | 38.82% | |
| 5 | 02:30 | 2.73 | 54.9% | |
| 6 | 10:24 | 9.62 | 31.55% | |
| 7 | 15:21 | 12.25 | 36.96% | |
| 8 | 04:19 | 3.69 | 33.32% | |
| 9 | 04:17 | 3.07 | 42.78% | |
| 10 | 14:42 | 15.49 | 34.84% | |
| 11 | 05:30 | 3.79 | 32.62% | |
| 12 | 01:22 | 1.21 | 80.77% | |
| 13 | 05:14 | 3.38 | 44.58% | |
| 14 | 02:11 | 3.19 | 35.49% | |
| 15 | 06:06 | 4.70 | 36.45% | |
| 16 | 05:47 | 3.56 | 45.36% | |
| 17 | 03:26 | 2.32 | 50.79% | |
| 18 | 04:26 | 4.79 | 37.35% | |
| 19 | 05:51 | 7.82 | 30.39% | |
| 20 | 07:43 | 8.95 | 29.65% | |
| 21 | 04:46 | 2.91 | 34.51% | |
| 22 | 05:49 | 4.70 | 38.14% | |
| 23 | 06:21 | 5.33 | 39.99% | |
| 24 | 01:32 | 1.85 | 65.61% | |
| 25 | 10:21 | 10.31 | 39.85% | |
| 26 | 06:29 | 5.08 | 41.73% | |
| 27 | 05:01 | 4.27 | 32.46% | |
| 28 | 09:07 | 4.88 | 33.66% | |
| 29 | 06:25 | 5.63 | 42.56% | |
| 30 | 01:59 | 2.01 | 57.9% | |
| 31 | 04:16 | 4.00 | 38.04% | |
| 32 | 05:15 | 5.92 | 44.88% | |
| 33 | 04:54 | 4.76 | 36.79% | |
| 34 | 04:30 | 3.19 | 38.51% | |
| 35 | 01:51 | 1.50 | 3.1% | |
| 36 | 00:58 | 1.51 | 69.53% | |
| 37 | 13:53 | 7.16 | 37.38% | |
| 38 | 05:14 | 5.15 | 32.68% | |
| 39 | 06:33 | 4.82 | 19.75% | |
| 40 | 02:05 | 4.30 | 22.97% | |
| 41 | 04:49 | 3.95 | 31.45% | |
| 42 | 02:04 | 2.73 | 43.19% | |
| 43 |  alexa.amazon.com |
01:08 | 2.67 | 56.71% |
| 44 | 01:53 | 2.80 | 46.8% | |
| 45 | 03:16 | 4.18 | 39.39% | |
| 46 | 02:24 | 3.05 | 34.6% | |
| 47 | 01:08 | 2.44 | 44.2% | |
| 48 | 01:20 | 2.91 | 40.49% | |
| 49 | 01:34 | 2.25 | 45.74% | |
| 50 | 01:08 | 3.48 | 39.89% |
How to read engagement: Character.AI’s 15:21 average visit and Bolt’s 13:53 reflect longer browser visits than many search-focused assistants; they do not reveal which professional domain or task consumed the time. Bounce rate and pages per visit describe website engagement, not the usefulness of AI answers. Because corporate websites and legacy subdomains appear separately, summing all 50 as distinct AI audiences would double-count some activity.
What’s trending in AI tool discovery?
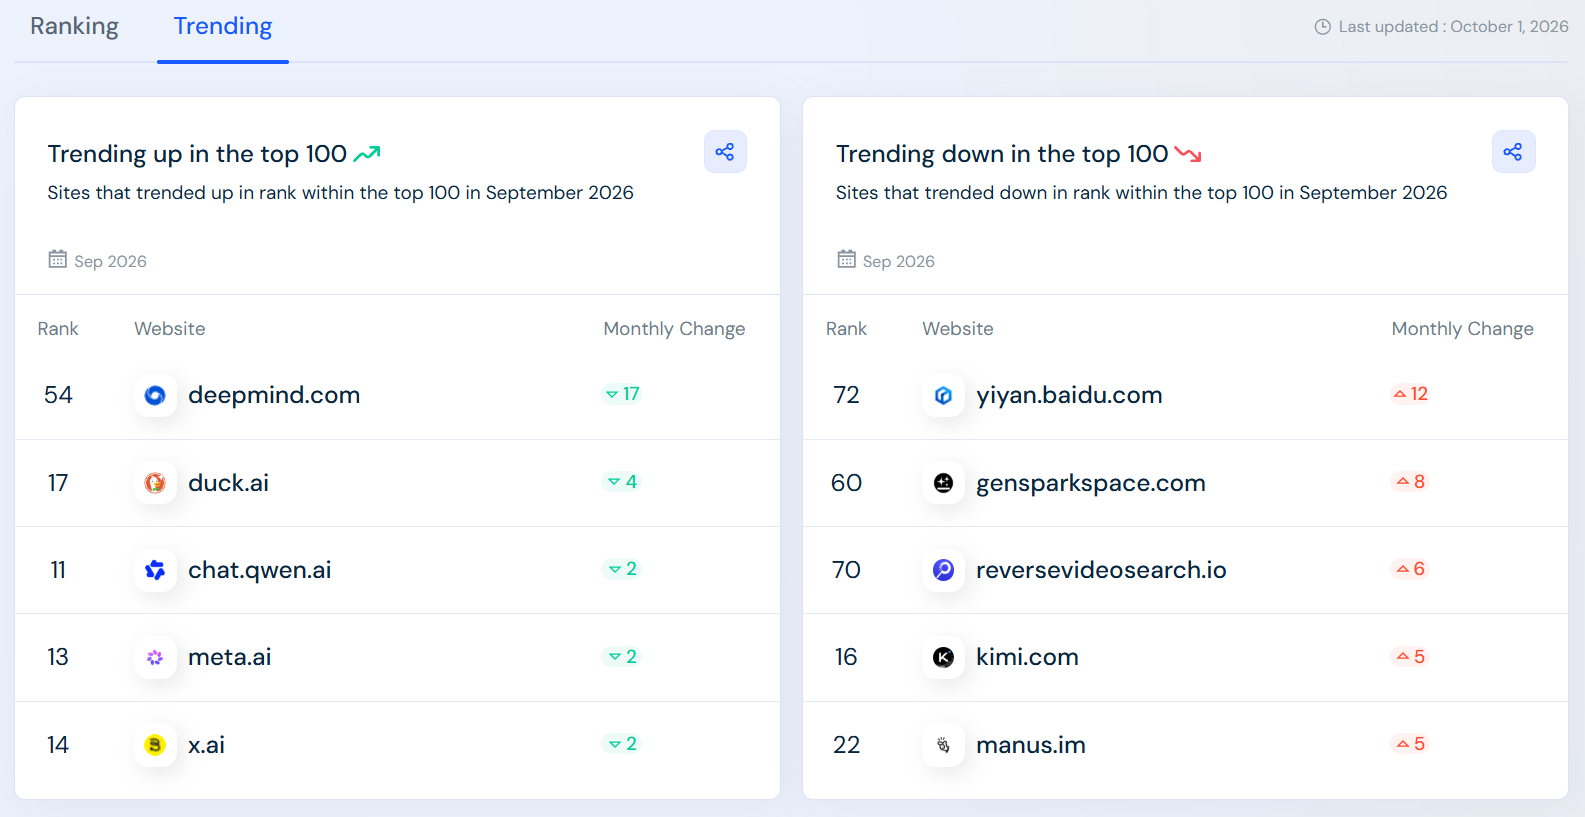
Among rising September category ranks were deepmind.com (+17 places, listed at #54), duck.ai (+4 to #17), chat.qwen.ai (+2 to #11), meta.ai (+2 to #13), and x.ai (+2 to #14). Notable declines included yiyan.baidu.com (−12, #72), gensparkspace.com (−8, #60), reversevideosearch.io (−6, #70), kimi.com (−5, #16), and manus.im (−5, #22). These are rank movements, not traffic growth percentages.
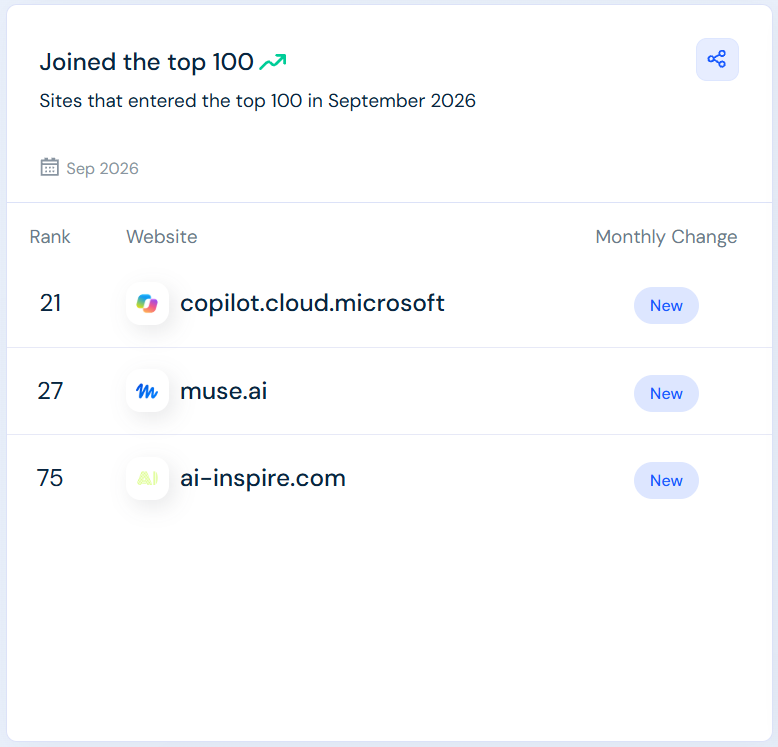
New top-100 entrants included copilot.cloud.microsoft (#21), muse.ai (#27) and ai-inspire.com (#75). For SEO/GEO, watch emerging surfaces without overreacting to single-month rank swings. A category move may reflect competitors’ traffic as much as a site’s own demand.
3. OpenRouter’s top 20 underlying LLMs
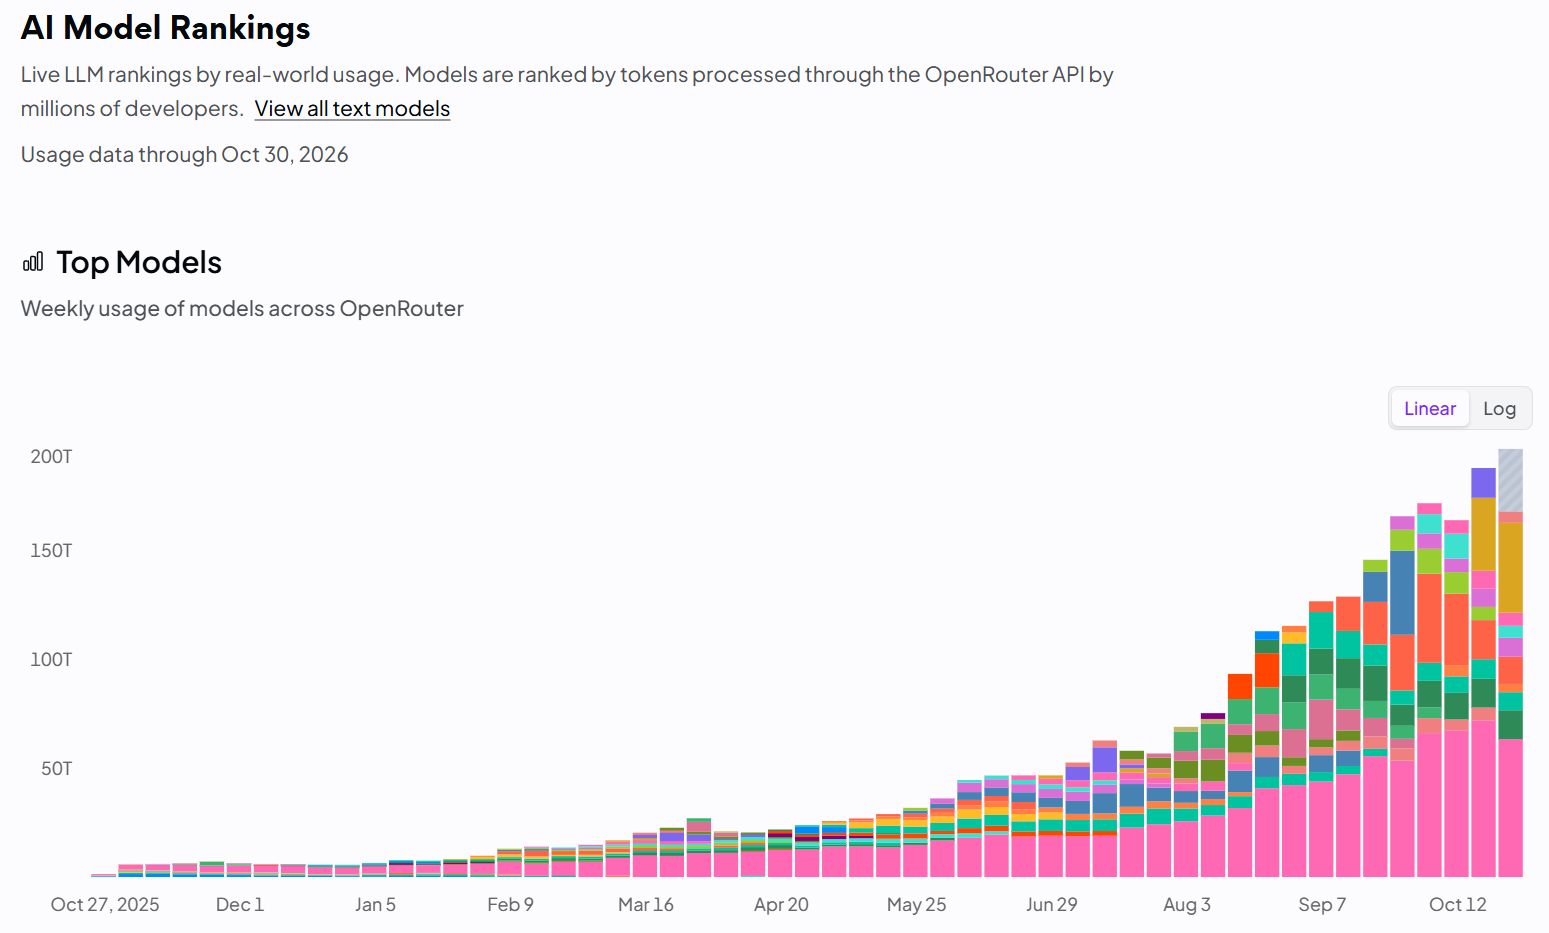
The weekly leaderboard below comes from your October 30, 2026 OpenRouter screenshot. Unlike assistant web sessions, it measures tokens routed through OpenRouter. Direct vendor API calls, private model deployments, and many embedded experiences are outside its scope.
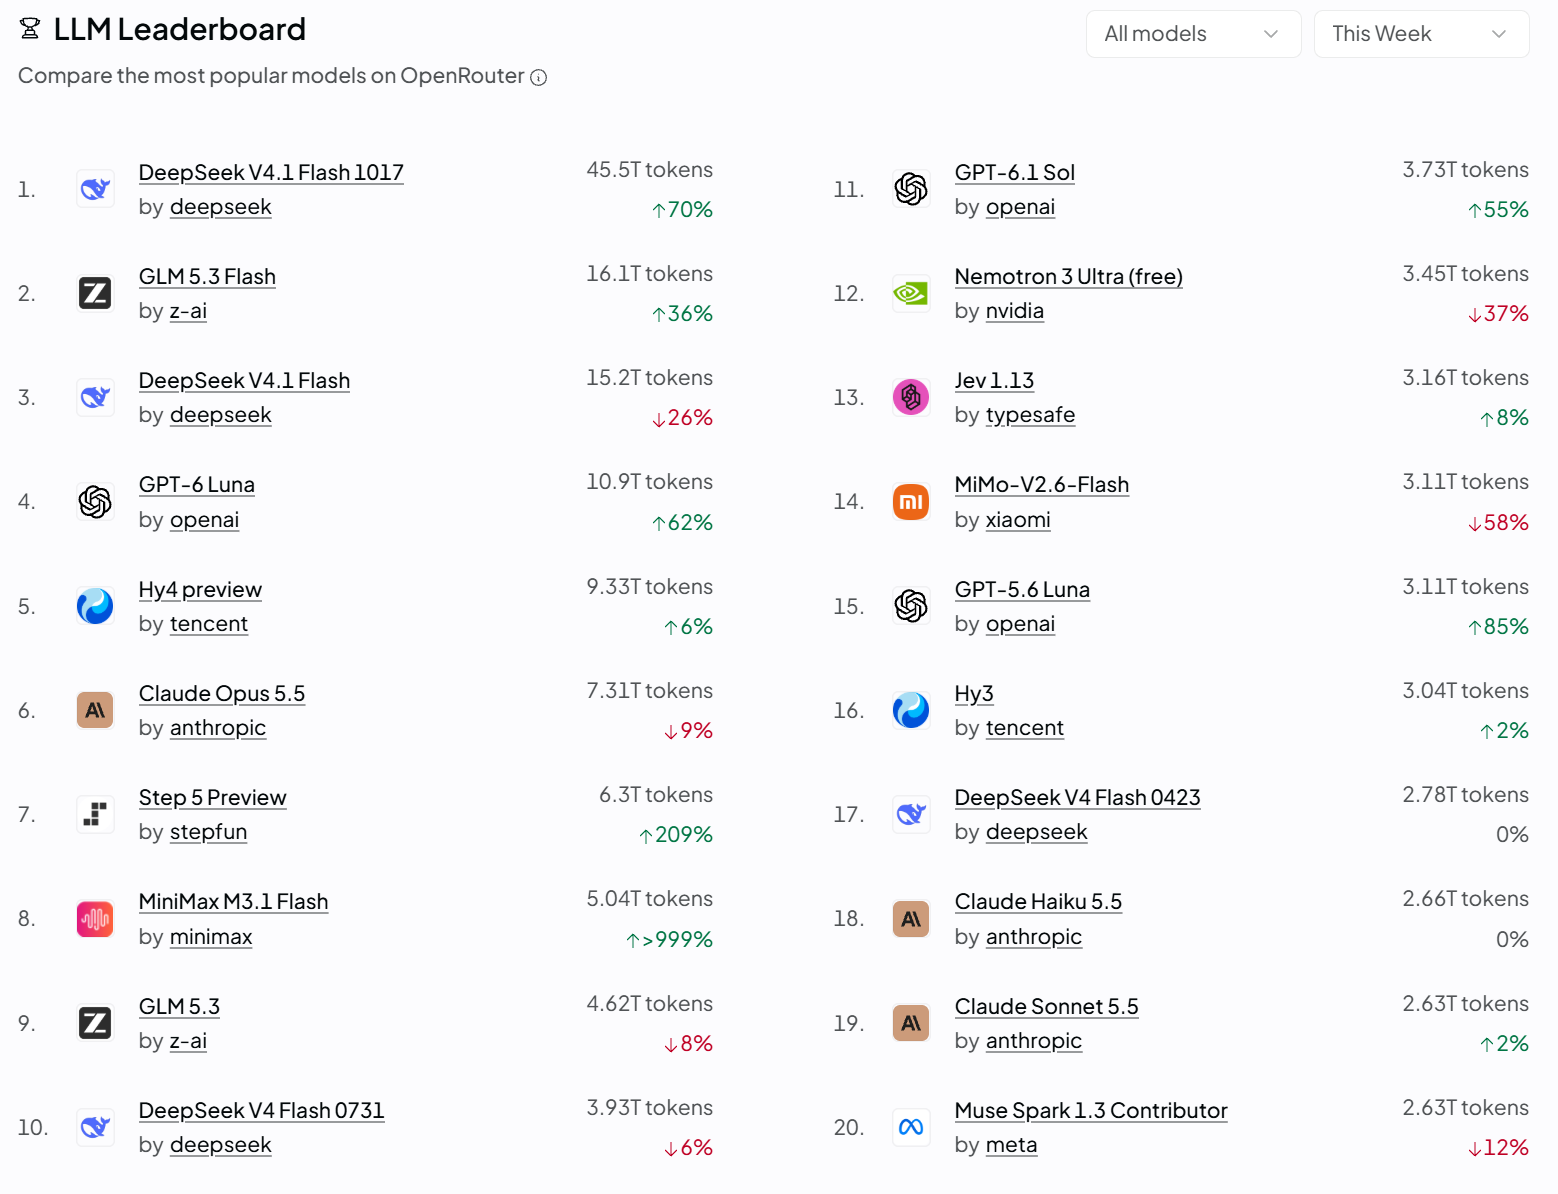
| Rank | Model | Developer | Weekly tokens | Weekly change |
|---|---|---|---|---|
| 1 | DeepSeek V4.1 Flash 1017 | DeepSeek | 45.5T | +70% |
| 2 | GLM 5.3 Flash | Z.ai | 16.1T | +36% |
| 3 | DeepSeek V4.1 Flash | DeepSeek | 15.2T | −26% |
| 4 | GPT-6 Luna | OpenAI | 10.9T | +62% |
| 5 | Hy4 Preview | Tencent | 9.33T | +6% |
| 6 | Claude Opus 5.5 | Anthropic | 7.31T | −9% |
| 7 | Step 5 Preview | StepFun | 6.3T | +209% |
| 8 | MiniMax M3.1 Flash | MiniMax | 5.04T | +>999% |
| 9 | GLM 5.3 | Z.ai | 4.62T | −8% |
| 10 | DeepSeek V4 Flash 0731 | DeepSeek | 3.93T | −6% |
| 11 | GPT-6.1 Sol | OpenAI | 3.73T | +55% |
| 12 | Nemotron 3 Ultra (free) | NVIDIA | 3.45T | −37% |
| 13 | Jev 1.13 | Typesafe | 3.16T | +8% |
| 14 | MiMo-V2.6-Flash | Xiaomi | 3.11T | −58% |
| 15 | GPT-5.6 Luna | OpenAI | 3.11T | +85% |
| 16 | Hy3 | Tencent | 3.04T | +2% |
| 17 | DeepSeek V4 Flash 0423 | DeepSeek | 2.78T | 0% |
| 18 | Claude Haiku 5.5 | Anthropic | 2.66T | 0% |
| 19 | Claude Sonnet 5.5 | Anthropic | 2.63T | +2% |
| 20 | Muse Spark 1.3 Contributor | Meta | 2.63T | −12% |
What jumps out: DeepSeek holds multiple high-volume slots, while Z.ai, Tencent, StepFun and MiniMax compete with OpenAI and Anthropic. High throughput often reflects low cost, workload size, automation and developer adoption. It does not establish a model’s share of consumer-facing brand recommendations.
4. What people actually do with AI models
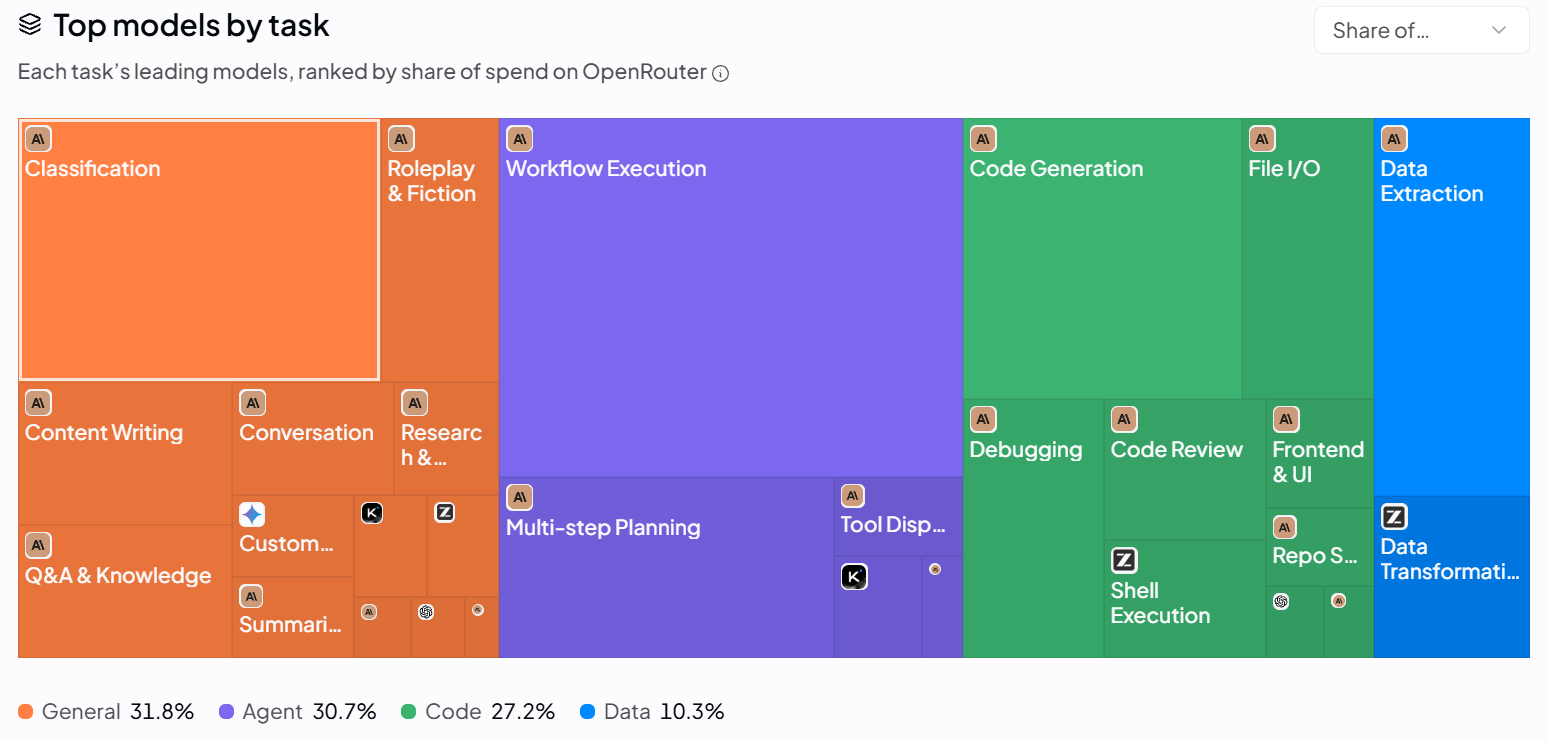
| Task family | Share of categorized spend | Examples | GEO/AEO significance |
|---|---|---|---|
| General | 31.8% | Classification, content writing, Q&A, research | Become a trusted answer and citation source |
| Agents | 30.7% | Workflow execution, multi-step planning, tool dispatch | Publish accessible, current facts agents can use |
| Code | 27.2% | Generation, debugging, reviews, UI | Maintain accurate API docs and technical examples |
| Data | 10.3% | Extraction, transformation | Make specifications and datasets verifiable |
The colored treemap is especially valuable because it shows why model choice changes by task. A business selling to developers should test coding assistants and documentation answers; a family dentist should concentrate on provider comparisons, quality, credentials and appointment intent. Task spending is not an estimate of hours people spend with AI.
5. Provider market share depends on which metric you choose
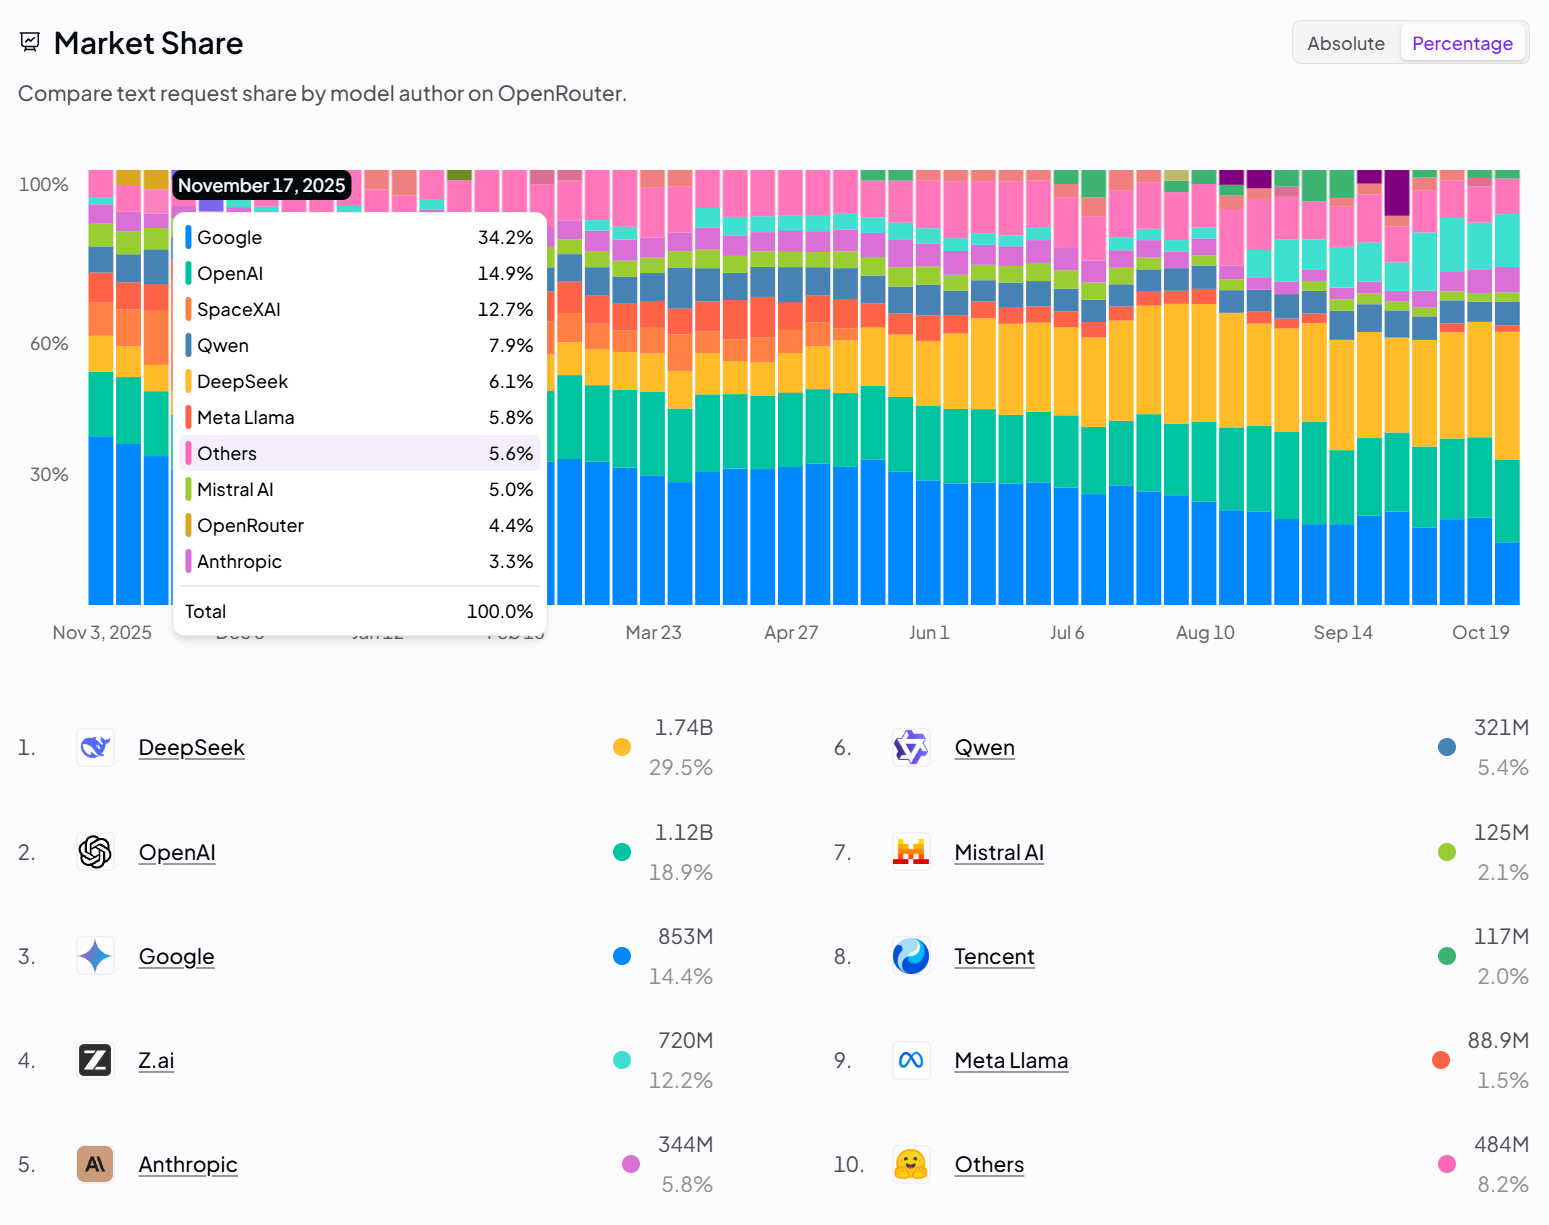
By token throughput, a low-cost long-context model may dominate. By number of requests, a provider serving smaller calls can rank higher. By standalone website traffic, ChatGPT leads. By citations or commercial referrals, another tool might have more influence in a particular industry. Each is a valid measurement of something different; none is a universal AI market-share statistic.
6. Which AI models are used for which functions? which models are used for which work?
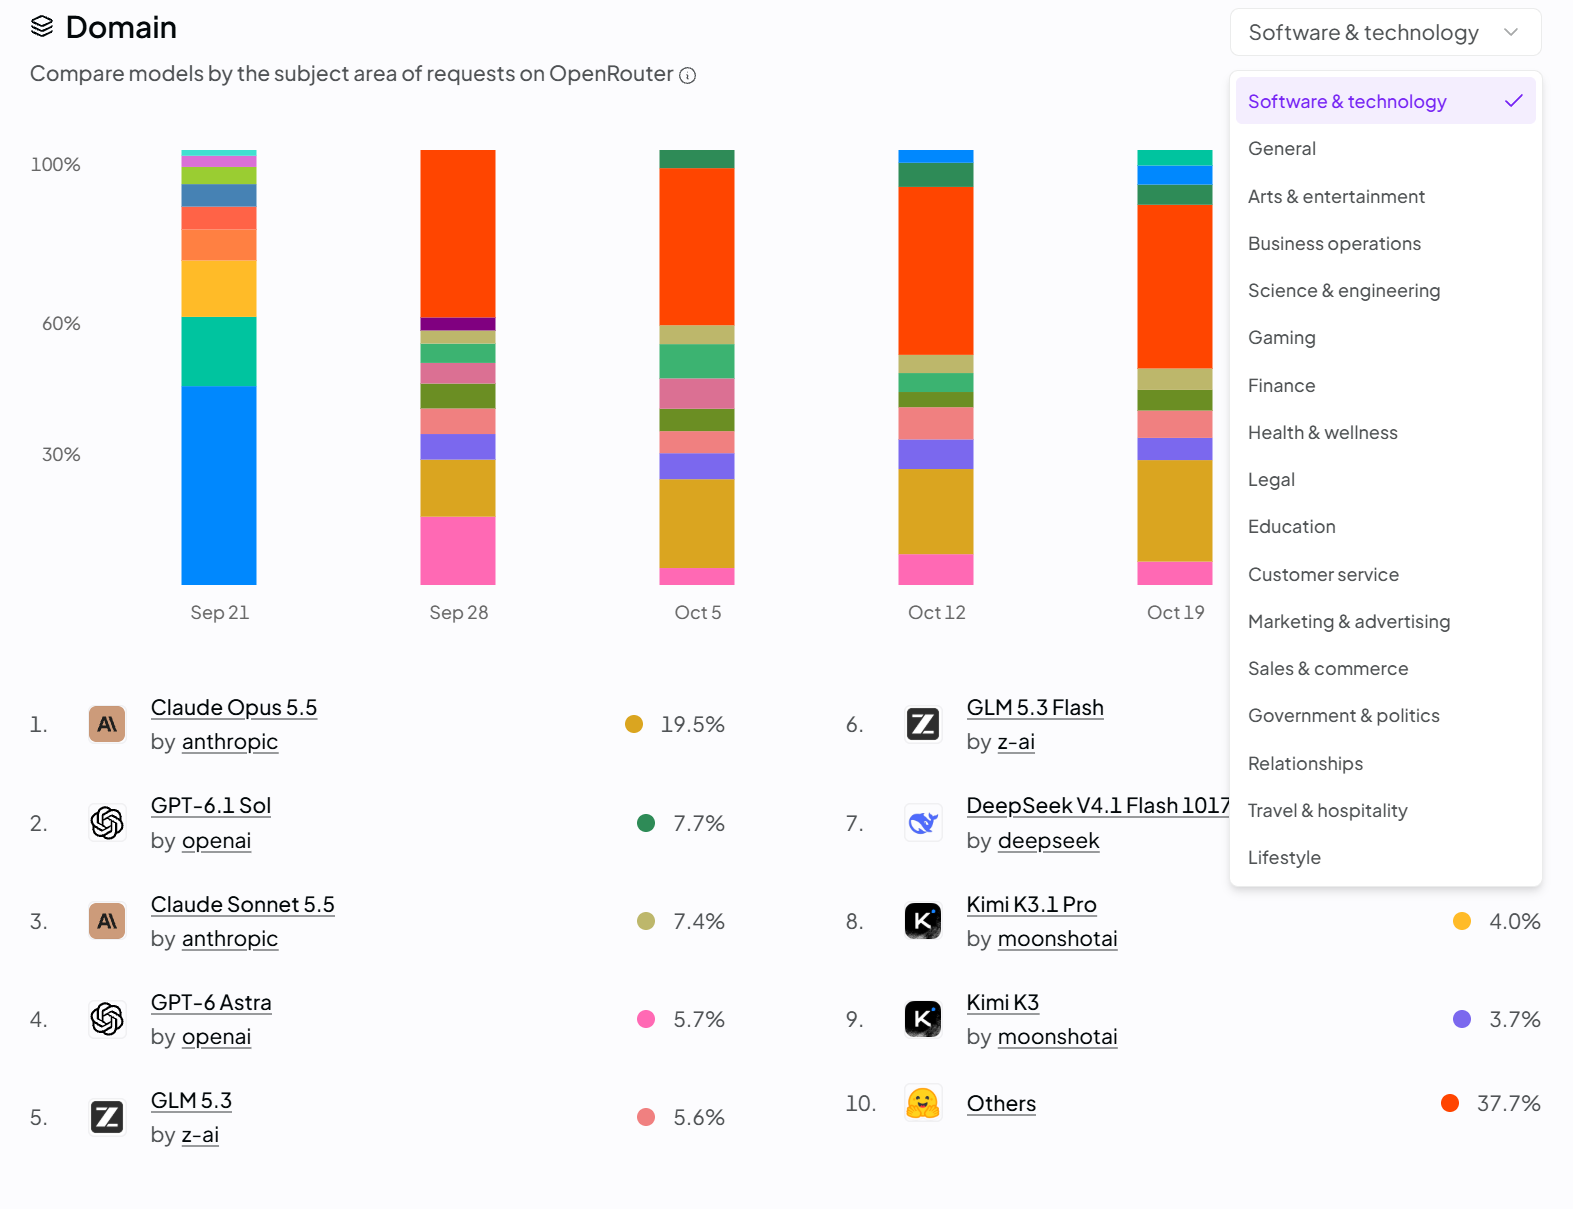
The screenshot for Software & Technology shows Claude Opus 5.5 at 19.5%, GPT-6.1 Sol at 7.7%, Claude Sonnet 5.5 at 7.4%, GPT-6 Astra at 5.7%, GLM 5.3 at 5.6%, Kimi K3.1 Pro at 4.0%, Kimi K3 at 3.7% and Others at 37.7%. These are domain-specific percentages from the displayed view, not global shares. The screenshot doesn’t establish leading models for the other fifteen domains; those must be checked individually.
| OpenRouter domain | Common tasks / questions | Evidence a brand should publish |
|---|---|---|
| General | Explanations, comparisons, recommendations | FAQ pages, grounded comparisons, local business facts |
| Arts & entertainment | Media, creators, events, concepts | Original visuals, credits, current event details |
| Business operations | Procurement, workflows, efficiency | Services, integrations, verified cases |
| Science & engineering | Research, technical explanations | Methods, primary citations, data |
| Gaming | Guides, discovery, hardware | Updated compatibility and product pages |
| Finance | Fees, comparisons, risk | Dated fees, qualified expert review, disclosures |
| Health & wellness | Symptoms, providers, services | Practitioner qualifications, medically reviewed pages |
| Legal | Jurisdiction, attorneys, practice areas | Attorney bios, legal references, verified locations |
| Education | Programs, training, admission | Curriculum, outcomes, costs and policies |
| Customer service | Returns, troubleshooting, warranties | Accessible help center, product documentation |
| Marketing & advertising | Agency research, campaign strategy | Methodology, case studies, reviews, pricing approach |
| Sales & commerce | Product fit, alternatives, availability | Products, inventory, returns, independent evidence |
| Government & politics | Services, regulations, civic questions | Official sources, dates, provenance |
| Relationships | Advice and personal communications | Expert resources without assuming purchase intent |
| Travel & hospitality | Planning, amenities, itineraries | Live booking links, location, accessibility, policies |
| Lifestyle | Beauty, home, fitness, fashion | Authentic visuals, detailed specs and verified reviews |
How much time do people spend in each domain?
The screenshots do not measure time spent per domain. OpenRouter’s domain view measures the makeup of requests or models, while its treemap measures spend. Similarweb’s average visit duration applies to a whole website across many tasks. It would be inaccurate to claim, for example, that legal questions take a certain percentage of users’ AI minutes. To measure that, an opt-in panel would need active foreground time, labeled prompts, device, session boundaries, country, and explicit rules for simultaneous or idle sessions. Publish request mix and time mix separately.
Even with that limitation, segmentation is powerful. A law firm can study jurisdiction and attorney-selection prompts; a software vendor can audit API-documentation answers; a retailer can study product comparisons and returns; a hotel can test amenities, location and booking answers. A universal set of ten prompts will never describe demand across hundreds of industries.
7. The hidden giants: embedded AI, mobile apps and international platforms
Website traffic is only the visible layer. Provider-reported ChatGPT, Gemini and Meta AI user counts include app and integrated experiences under differing definitions. Google AI appears within Search; Microsoft Copilot appears in enterprise software; Meta AI appears in social applications; China has large local AI ecosystems including Doubao and Qwen. Their audiences overlap, and figures with different definitions cannot be added together.
Corporate organizations can run models over private documents through APIs or inside networks. Some use self-hosted/open-weight models without any requests reaching public gateways. Consequently neither Similarweb nor OpenRouter can provide a worldwide census of all AI usage.
8. How to use this research in a GEO/AEO strategy
Start with customer intent, not the model leaderboard. We recommend initially testing ChatGPT, Gemini/Google AI and Claude for many U.S. businesses, then adding Perplexity, Copilot, Grok, DeepSeek, Qwen or vertical tools where audience evidence justifies them. These are strategic test priorities, not guarantees of rankings.
- Map buyer conversations. List discovery, shortlisting, comparison, price, qualification, objection and booking/purchase turns for each business segment.
- Test identical intents on multiple surfaces. Record date, location, device, personalization state, prompt phrasing and full responses.
- Measure recommendations. Record brand appearance, competitor mentions, citations, factual errors, sentiment and sources—not just a simple rank.
- Improve evidence. Make service pages, location information, expert biographies, original research, genuine reviews, product specifications and policies easy to verify.
- Track outcomes. Combine AI referral sessions, assisted conversions, qualified inquiries and revenue with visibility metrics.
For example, a Seattle dentist should test implants, financing, specialist qualifications and local comparisons. A law firm should test practice areas, fees and jurisdiction. A B2B software company should test alternatives, APIs, security and integration fit. An ecommerce brand should test product fit, materials, returns, stock and competing products. The content needed to appear in credible answers will differ dramatically.
SEO fundamentals still matter: crawlability, accurate information, useful content, descriptive titles, clear page structure, appropriate structured data and an accessible user experience. GEO/AEO adds a new measurement layer for synthesized answers and sources, rather than replacing those fundamentals.
9. The simplest way to think about AI usage
| Surface | What you can measure | What’s typically missing |
|---|---|---|
| Desktop browser | Web visits, pages and visit duration | Native apps and internal API jobs |
| Mobile browser | Mobile-web visits | Native mobile app interactions |
| Native apps | App installs, active users and app sessions when reported | Third-party and private activity |
| Embedded AI | Search features, social AI, office productivity, customer-service experiences | Standalone assistant-only measurement |
| Public APIs | Requests, tokens, model spending | Consumer context and private APIs |
| Private servers/corporate networks | Internal logs, deployment and task metrics when authorized | Public discovery by independent trackers |
A single individual might use Gemini in search, ChatGPT on a desktop, a phone app on the train and an internal company assistant at work. Public leaderboards count different slices of those interactions. For GEO and AEO, prioritize the interfaces affecting buying decisions and verify whether your business is mentioned, cited and chosen.
Sources and research limitations
Primary sources: Similarweb AI Chatbots & Tools (October 1, 2026 update; supplied screenshot of top 50 and trending), OpenRouter Rankings (supplied top-20 and analytic panels through October 30, 2026), Visual Capitalist’s Similarweb-based September chatbot study, and Google Search Central’s helpful content guidance. Rankings can change daily and vary by geography, filter, platform and methodology. The screenshots document historical snapshots, not a live feed. Some Similarweb chart rows are different websites operated by the same companies. OpenRouter metrics exclude direct vendor API and private deployments. Spend, requests, tokens and time are not interchangeable.
Want to know which AI assistants actually recommend your business? Contact Seattle Organic SEO for an SEO, GEO and AEO visibility assessment.
Written by the Seattle Organic SEO Team. Founded in 2010, Seattle Organic SEO brings more than 30 years of combined experience in organic search, paid media, analytics and digital marketing. Our team’s background includes leading technology companies such as Amazon, Expedia and DoubleClick, later acquired by Google. Learn about our team.