
Traffic Sources for Top Websites?
If you search for the phrase “marketing sources for top companies,” you’ll get a plethora of results around past strategies that have worked for the “digitally savvy” companies out there. You’ll hear anecdotes about how the late founder at Zappos wrote a book about taking care of customers to Uniqulo’s “fast-moving” image campaign which delivered a unique product code indecipherable to the naked eye. While these are great for learning creative ways of targeting customers, it doesn’t give a formula on how the companies that have the most traffic online have achieved their online ubiquity.
Today, we’re going to share how the top 50 companies online (according to SimilarWeb) are attaining their website traffic. The goal is to frankly find “how” these companies have attained their success and what channels contribute to this success. The companies we’ll be examining are as follows with their ranking (in parentheses) in the top market capitalization list provided from companiesmarketcap.com.
The Top 50 Most Ubiquitous Sites Online
| 1 (#4) | google.com |
| 2 (#4) | youtube.com |
| 3 (#5) | facebook.com |
| 4 | twitter.com |
| 5 (#5) | instagram.com |
| 6 | wikipedia.org |
| 7 | baidu.com |
| 8 (#24) | yahoo.com |
| 9 | yandex.ru |
| 10 | xvideos.com |
| 11 (#5) | whatsapp.com |
| 12 (#83) | zoom.us |
| 13 (#3) | amazon.com |
| 14 | xnxx.com |
| 15 (#2) | live.com |
| 16 | netflix.com |
| 17 (#24) | yahoo.co.jp |
| 18 | pornhub.com |
| 19 | reddit.com |
| 20 (#2) | office.com |
| 21 | vk.com |
| 22 (#2) | linkedin.com |
| 23 | discord.com |
| 24 | pinterest.com |
| 25 | xhamster.com |
| 26 | twitch.tv |
| 27 | naver.com |
| 28 | tiktok.com |
| 29 (#2) | microsoft.com |
| 30 (#2) | bing.com |
| 31 | qq.com |
| 32 | mail.ru |
| 33 | roblox.com |
| 34 | duckduckgo.com |
| 35 (#2) | microsoftonline.com |
| 36 | globo.com |
| 37 | ebay.com |
| 38 | jerkmate.com |
| 39 (#4) | google.com.br |
| 40 (#2) | msn.com |
| 41 | fandom.com |
| 42 (#24) | news.yahoo.co.jp |
| 43 | bilibili.com |
| 44 | bbc.co.uk |
| 45 (#14 globally) | samsung.com |
| 46 | uol.com.br |
| 47 | docomo.ne.jp |
| 48 | ok.ru |
| 49 (#67) | weather.com |
| 50 | accuweather.com |
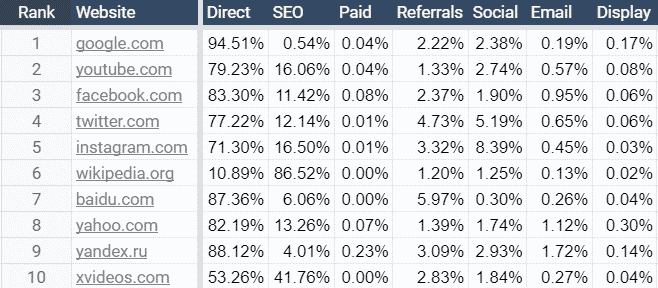
Organic SEO = TRUE #1 Driver of Traffic
As much as 86.52% of the website traffic of these top online performers is driven by SEO (i.e., organic search engine optimization).*** SEO is literally the MOST POWERFUL digital marketing channel, yet marketing divisions and leaders still fail to realize the importance of it. Frankly, I even question myself sometimes as to why I continue to publicize this “secret” that could blow up any business or entity on the web (if they take it serious), but it’s hard for me to hold back (thus, the millionth post highlighting this). 
While there are sites that have as low as 4.86% of their total traffic being organic search, most sites (68%) generate more than 10% of their traffic from SEO. It ranks by far the #1 source beyond direct (which we’ll speak to below). The next best source was “referrals”. The other sources were miniscule comparatively. Social had only 1 site that had more than 10% of their traffic come from the source (with the majority hovering between 0.3% to 8.39% of their traffic being socially created). Email, Display and Paid Search/Digital being the lowest sources of traffic.
So, if your goal is to become a “top brand,” you should be completely enamored and focused on SEO.
***Wikipedia.org ranks #6 w/ SimilarWeb’s Top 50 Websites and according to their April 2021’s data, SEO generated (by and far) the largest amount of traffic to the most popular reference site in the world.
Direct Traffic is the #1 Source (w/ a caveat)
While the data highlighted in the study will show “direct traffic” is the #1 source (today) for the top sites, don’t forget that they were not a “top site” right off the bat. It was SEO that got them there. So, in the early stages (as you’ll see with my next post highlighting “Marketing Sources for the Fastest Growing Companies”), SEO is what got these sites to their ubiquitous presence.
Biz Dev Deals (Referrals) are the #2 Source
As mentioned, referral traffic was one of the larger sources of traffic. Most sites were between ~1% and 9% with two adult sites receiving as much as 25%+ to 32%+ of their traffic from referrals. Japanese site http://docomo.ne.jp/ garnered as much as 46% of its traffic from sister sites.
However, only 8 out of the top 50 sites (16%) had more than 10% of their traffic coming in from this source (& the 2 sites with the highest referrals frankly just had another part of their domain or sister property refer over the traffic — i.e., yahoo -> news.yahoo or office or microsoft -> microsoftonline.com).
Social is #3
While social media sites represent 4 out of the top 5 most trafficked sites in the world, they don’t send as much traffic to these top websites as main sources. YouTube ranks #2 behind Google with Facebook, Twitter and Instagram trailing as the highest trafficked websites in the world.
Only 2 websites, TikTok and Instagram (which happen to also be social websites), were the only 2 properties that had more than 8% of their traffic resulting from other social sources. The rest of the 48 had 7.24% or less of their traffic come from social media. Eighty-six (86%) percent of the sites had less than 5% of their traffic come from sites like YouTube, Facebook or Twitter.
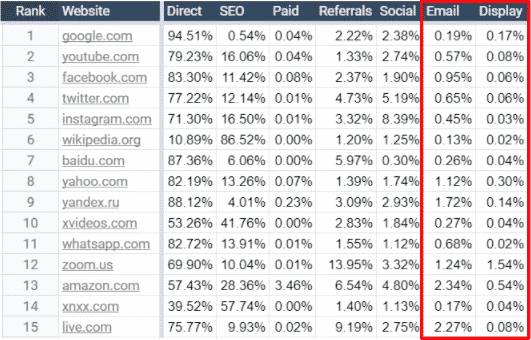
Display & Email Trail
While email’s efficacy is quite high, it still doesn’t rank in the highest sources of traffic. Despite:
- “email (being) still one of the most reliable methods to boost content marketing”
- “87% of B2B marketers use email as a distribution channel” and
- “email is the most reliable channel for nurturing and converting leads to sales throughout a funnel”
Display also creates very little traffic for these top websites. For this mini-study, only 4 websites had more than 2% of their traffic originate from display advertising. One adult website generated close to 40% of its most recent traffic from display, but for the most part, all the websites failed to attract any more than 1.54% of their traffic through display.
The TRUE last is paid digital
Paid digital ranks last in sending over traffic. It’s not because companies aren’t spending, but these are mature companies. Ideally, after you get to their level, you don’t need to allocate as much to your marketing budget for paid digital spend. Isn’t this what you hope for as a CMO? I know CEOs definitely wish this!
The numbers for growing numbers is vastly different. We’ll show you how growing companies actually generate a bit of their initial traffic via paid.
The highest amount (by percentage) is Amazon.com. At the ecommerce giant, 3.46% of the total traffic comes from paid search marketing. You’ll see below how much Amazon spends per month. If you total it, they are at a $200+ million/year in ad spend per year. However, it still only represents less than 4% of their total traffic sources.
Most sites range from 0.00% to 0.85% minus only one property which generated a little over 6% of their traffic from paid search. Ninety-six (96%) percent of the top 50 properties failed to generate more than 1% of their traffic from this source.
Despite the miniscule percentage being generated, websites like Monday.com spend hundreds of millions in ad spend. And there are many sites which you have companies spend the following amounts on the top end for Google ads:
|
Rank
|
Domain
|
Ad Budget
|
Seo Clicks
|
Contact Types
|
|
1
|
$17.4M
|
3.37B
|
||
|
2
|
$12.9M
|
29.9k
|
||
|
3
|
$7.01M
|
555k
|
||
|
4
|
$5.78M
|
3.89M
|
||
|
5
|
$5.22M
|
9.6M
|
||
|
6
|
$5.05M
|
473M
|
||
|
7
|
$5.02M
|
198M
|
||
|
8
|
$4.02M
|
12.4M
|
||
|
9
|
$3.88M
|
0
|
||
|
10
|
$3.79M
|
410M
|
||
|
11
|
$3.79M
|
504M
|
||
|
12
|
$3.71M
|
50M
|
||
|
13
|
$3.5M
|
3.32M
|
||
|
14
|
$3.44M
|
2.4k
|
||
|
15
|
$3.43M
|
7.46
|
||
|
16
|
$3.36M
|
130M
|
||
|
17
|
$3.26M
|
80.2
|
||
|
18
|
$3.17M
|
1.5M
|
||
|
19
|
$3.16M
|
27.3M
|
||
|
20
|
$3.07M
|
11.4M
|
||
|
21
|
$2.98M
|
2.33M
|
||
|
22
|
$2.9M
|
10.3M
|
||
|
23
|
$2.87M
|
308M
|
||
|
24
|
$2.82M
|
0.12
|
||
|
25
|
$2.75M
|
2.61k
|
||
|
26
|
$2.69M
|
0
|
||
|
27
|
$2.67M
|
2.54M
|
||
|
28
|
$2.64M
|
31.4M
|
||
|
29
|
$2.58M
|
29.2M
|
||
|
30
|
$2.56M
|
7.76k
|
||
|
31
|
$2.49M
|
6.47
|
||
|
32
|
$2.41M
|
49.5
|
||
|
33
|
$2.4M
|
4.89M
|
||
|
34
|
$2.32M
|
2.77M
|
||
|
35
|
$2.29M
|
162k
|
||
|
36
|
$2.26M
|
6.01M
|
||
|
37
|
$2.25M
|
13.1M
|
||
|
38
|
$2.18M
|
78.3
|
||
|
39
|
$2.14M
|
1.98M
|
||
|
40
|
$2.08M
|
933k
|
||
|
41
|
$2.07M
|
336M
|
||
|
42
|
$2.05M
|
227
|
||
|
43
|
N/A
|
$2.02M
|
973k
|
|
|
44
|
$1.99M
|
165M
|
||
|
45
|
$1.95M
|
10.6M
|
||
|
46
|
$1.92M
|
14.4M
|
||
|
47
|
$1.9M
|
48.3M
|
||
|
48
|
$1.85M
|
6.07k
|
||
|
49
|
$1.78M
|
10M
|
||
|
50
|
$1.75M
|
645
|
||
|
51
|
$1.75M
|
103M
|
||
|
52
|
$1.71M
|
499
|
||
|
53
|
$1.71M
|
867k
|
||
|
54
|
$1.67M
|
115M
|
||
|
55
|
$1.63M
|
196M
|
||
|
56
|
$1.61M
|
4.35M
|
||
|
57
|
$1.59M
|
4.38M
|
||
|
58
|
$1.57M
|
2.03M
|
||
|
59
|
$1.51M
|
61.4M
|
||
|
60
|
$1.49M
|
196M
|
||
|
61
|
$1.46M
|
56.4M
|
||
|
62
|
$1.46M
|
18.6M
|
||
|
63
|
$1.45M
|
22.4M
|
||
|
64
|
$1.44M
|
88.1M
|
||
|
65
|
$1.42M
|
2.29M
|
||
|
66
|
$1.42M
|
272k
|
||
|
67
|
$1.41M
|
16.9M
|
||
|
68
|
$1.39M
|
119
|
||
|
69
|
$1.34M
|
8.62M
|
||
|
70
|
$1.32M
|
107k
|
||
|
71
|
$1.32M
|
103M
|
||
|
72
|
$1.32M
|
1.34k
|
||
|
73
|
$1.31M
|
1.6k
|
||
|
74
|
$1.3M
|
219
|
||
|
75
|
$1.3M
|
4.16k
|
||
|
76
|
$1.3M
|
6.63M
|
||
|
77
|
$1.28M
|
0
|
||
|
78
|
$1.27M
|
240k
|
||
|
79
|
$1.27M
|
9.61M
|
||
|
80
|
$1.26M
|
304k
|
||
|
81
|
$1.25M
|
5.8M
|
||
|
82
|
$1.24M
|
0
|
||
|
83
|
$1.23M
|
9.41M
|
||
|
84
|
$1.23M
|
459
|
||
|
85
|
$1.23M
|
6.76k
|
||
|
86
|
$1.19M
|
18.2M
|
||
|
87
|
$1.17M
|
10.7M
|
||
|
88
|
$1.17M
|
4.14k
|
||
|
89
|
$1.17M
|
797k
|
||
|
90
|
$1.17M
|
36.8M
|
||
|
91
|
$1.16M
|
23.9M
|
||
|
92
|
$1.16M
|
17.3M
|
||
|
93
|
$1.16M
|
3.13M
|
||
|
94
|
$1.15M
|
629k
|
||
|
95
|
$1.14M
|
0
|
||
|
96
|
$1.12M
|
908k
|
||
|
97
|
$1.11M
|
157k
|
||
|
98
|
$1.1M
|
5.1M
|
||
|
99
|
$1.09M
|
1.08M
|
||
|
100
|
$1.08M
|
155k
|
**SimilarWeb may also not have accurate numbers. So, the percentage of traffic that comes through the paid channel may be higher.