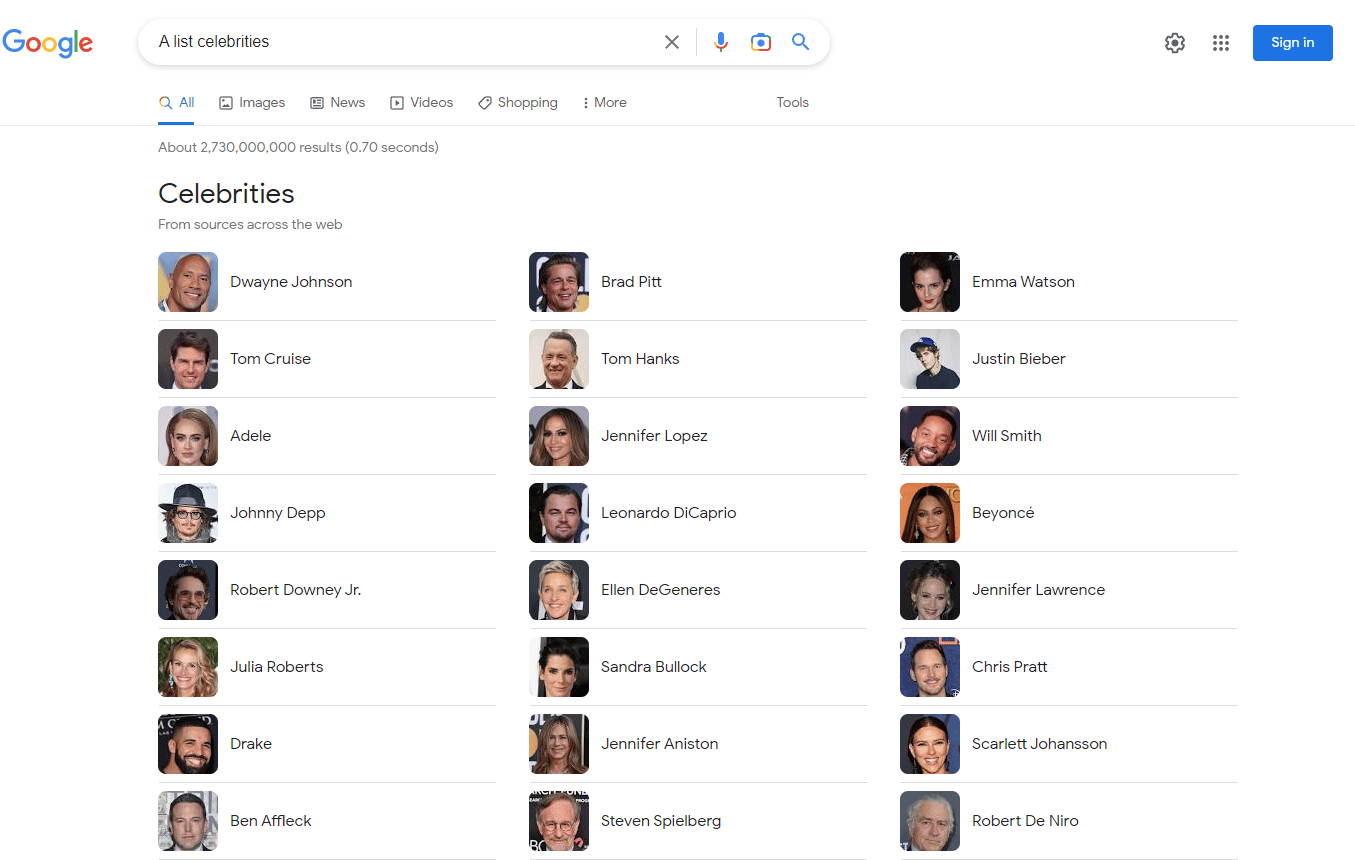
Instead, we are now seeing an accordion like view (structure) where you get a preview of 9 images and their respective names/titles:
And if you click on the middle button titled “42 more” with a down arrow, you literally get 42 more in the list to show up in the SERP:
We’ve created a quick video showing how it works live. You can see the new “accordion SERP feature” that is seemingly replacing the carousel (at least from what we’ve seen).
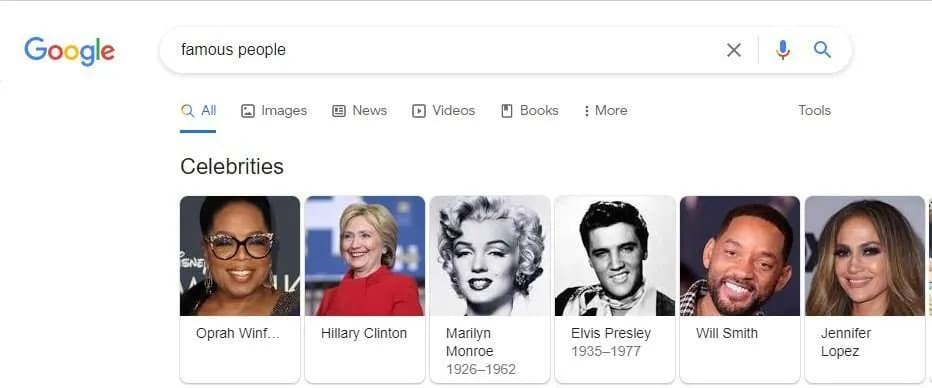
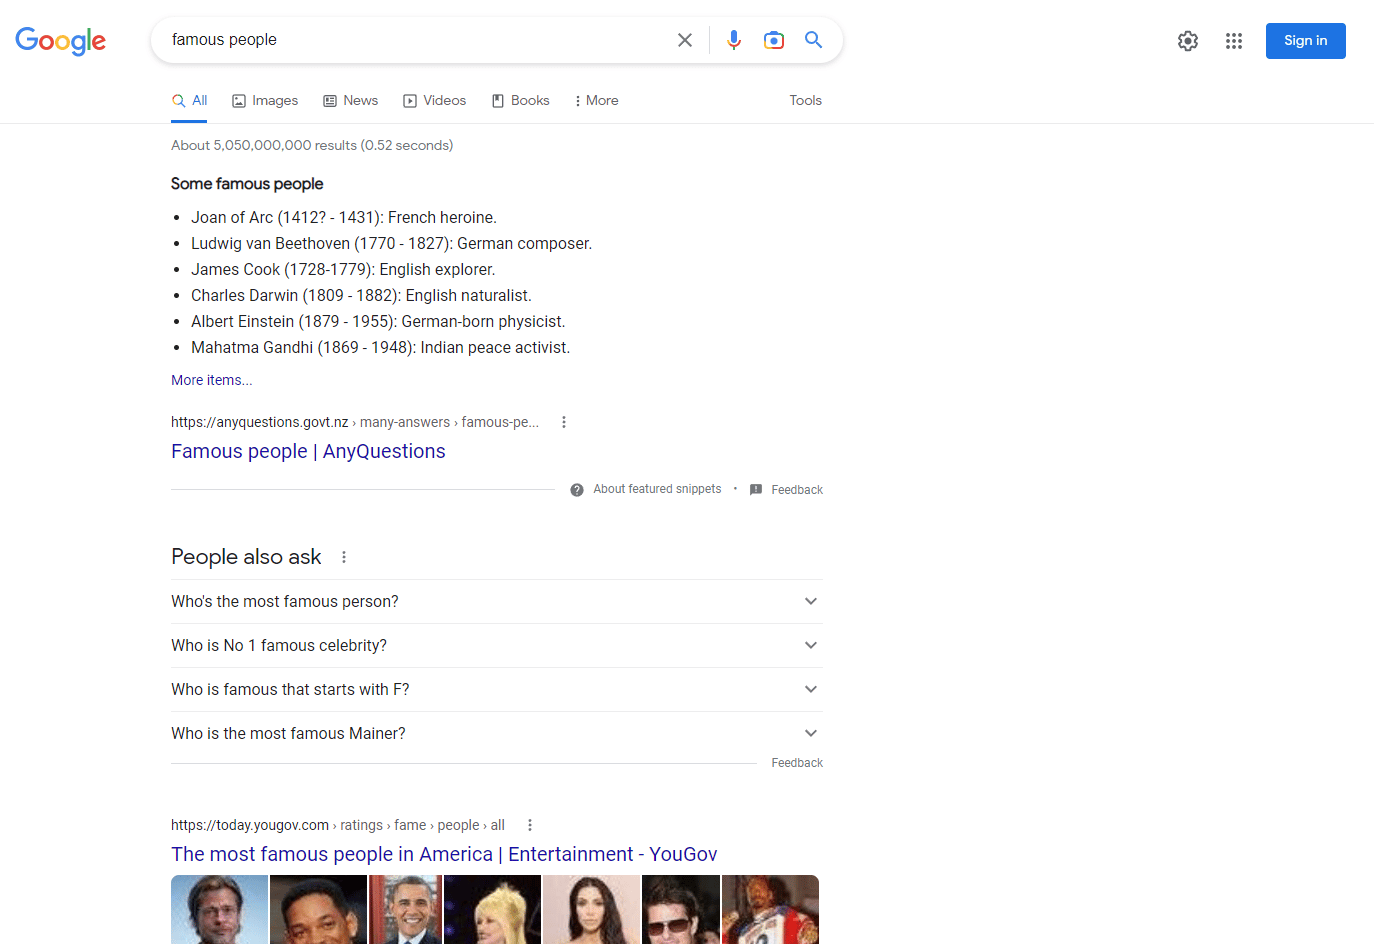
*Note: the search permutation is different because Google has decided that “famous people” searches (for me at least on desktop and in chrome) deserve the featured snippet, people also ask & images pack before the traditional results and a video set in the SERP instead. We used a few different permutations and found “a list celebrities” generated the new accordion style of results (do note: it’s not “a list OF celebrities”, but “a list celebrities”; the slight difference will give you different SERPs). Here’s the screenshot of the top of the SERP (November 2022) of “famous people”:
We knew that SEMRush kept track of what percentages of each SERP feature occurred across 25 categories along with the average for all searches. However, we were wondering if possibly the Carousel searches had increased or decreased and also what exactly was the percentage. As you’ll see below, there weren’t that many carousel searches overall — less than 1%. With that said, the carousel was a very interesting, but very subjective set of results that could potentially impact society’s opinions and beliefs about the results. Some searches we noticed had the new accordion/old carousel results were:
best universities (but not “top universities” interestingly)
best actors
a list celebrities
best adventure books (below the shopping results)
Who’s to say these are truly the “best” except google and all the people who see them? Fascinating how we could be influenced by these. Maybe some day someone will study what people believed before and after.
Regardless, we are very curious about the changes from time to time. As a result, we decided we will do our best to collect and post this data moving forward like we try to do with all the Search Engine Market share data or Top Websites. Having this archive will hopefully answer the next time if one of the many SERP features increased/decreased or stayed the same. While it’s not that critical, it can definitely be important however for some industries if the percentages are higher. We are working on a set of criteria of figuring out how to decide how optimally your site might be for the search engines or “How truly SEO’d are you?” Some of the criterion will relate to “Are you showing up for the featured snippets for your field/area?” “Do you spend a bit on Google ads?” because your industry has a ton of ads showing up for most of the searches. “How’s your video exposure?” There will be much more we’re planning on incorporating instead of just looking at our google analytics or search console to see we have more clicks or visits because of organic. Unfortunately, that’s too primitive these days with competition rising in our industry.
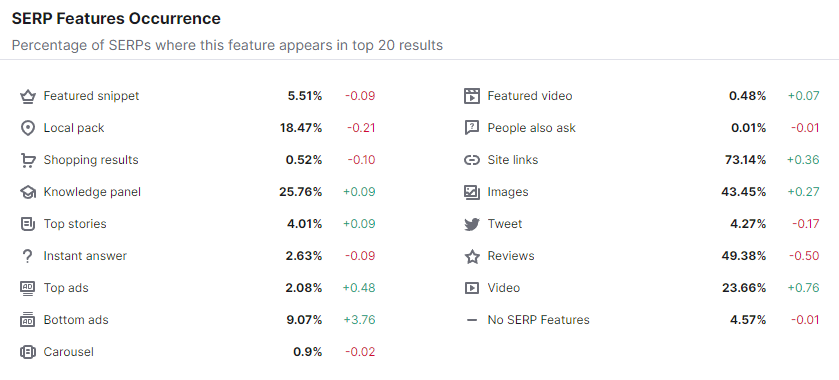
SERP Feature Occurrence % for All Industries:
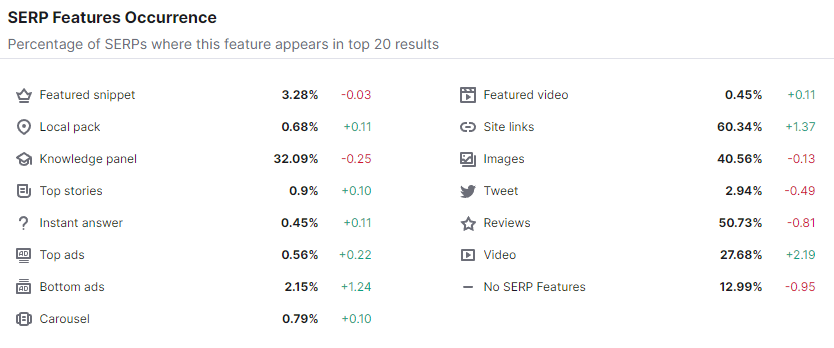
Courtesy of SEMRush’s Sensor, we have data for what type of SERP features show up per industry (or category as they define it). Here, we start off by looking at what percentage of the time do we see Knowledge Panels or Images or Site Links show up for all searches. Pulling from the above, we see the Top 3 as:
Sitelinks showing up for 73.14% of all searches
Reviews show up 49.28% of the time
Images appear to show up in 43.45% of all permutations
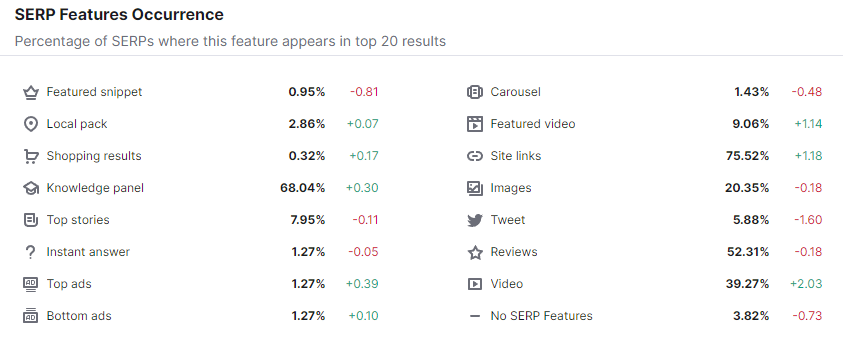
Arts & Entertainment (Desktop):
As you can see, with Arts & Entertainment, there’s quite a bit more showing up in the Knowledge Panel (68.04%) and you may see more carousels (1.43% vs. 0.48% for all searches) for queries like “top actors” or “a list celebrities.” However, what’s fascinating though is that the Mobile SERP is a bit different:
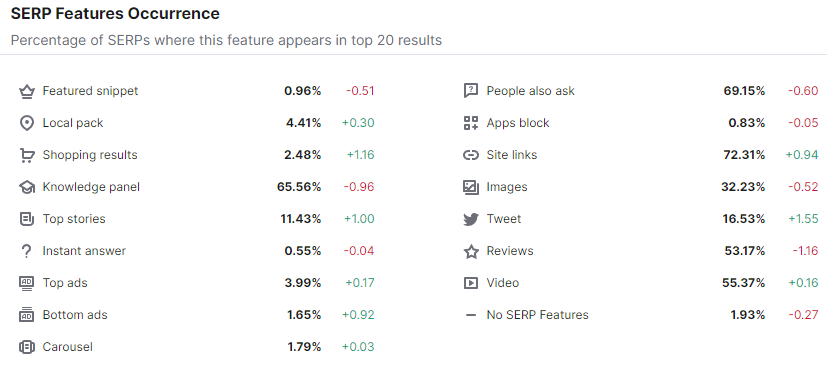
Arts & Entertainment (Mobile):
There’s a higher ratio of Tweets (16.53%) in the SERPs and MUCH more video (55.37%) vs. the general SERP. Other interesting SERP features are obviously important for the A&E world. Take a look!
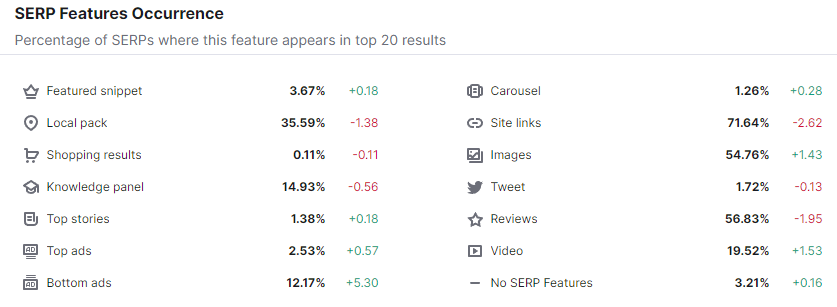
SERP Feature Frequency % for Automotive:
In Automotive Desktop SERPs which could include anything from phrases of top brands like “Toyota” or “Tesla” to local Dealerships or even Auto Parts. You can see the higher percentage of the Local Pack (almost double that of the general search at 35.59%) and almost 1/3rd of the tweets at 1.72%. While we shared some of the Mobile SERP Features % of Occurrence for Arts & Entertainment, we’ll dedicate another post to all 26 categories and the general percentages in another post.
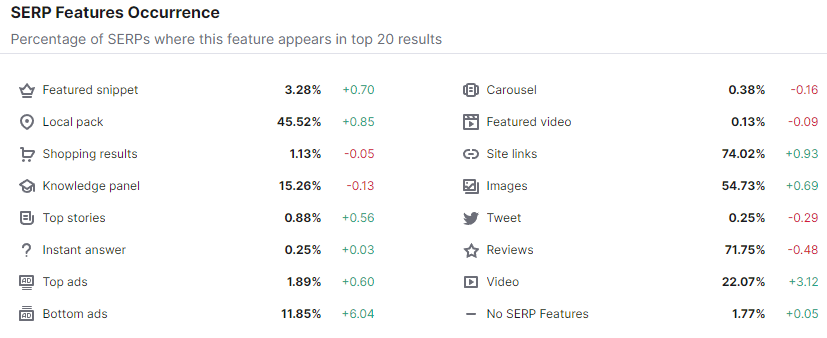
Beauty & Fitness:
For Beauty and Fitness searches, there are significant more “Local Pack” results than the average SERP according to SEMRush. Supposedly 45.52% of beauty & fitness searches are filled with the local pack. Given that many “beauty services” may need to be done by professionals “near” people, we can see the “search phrase + near me” phrases possibly boosting this percentage to almost 1/2 of the searches. An example is “hair care near me.” Simultaneously, reviews will also be high as a result since the reviews of local businesses will usually accompany the local pack results. Along with the local packs, many shopping results may pop up despite the number above by SEMRUsh reporting it to being quite low (1.13%). In the shopping results, there are “reviews” as well which boosts the 71.75% of the SERPs having the “reviews serp feature” showing up for this category.
Books & Literature:
In the Books & Literature category, Sensor reports a very insignificant amount of Local Pack results (0.68%) compared the average of 18.47%. Most SERP features for Books & Literature resemble the norm, but there are also more than 4Xs less Google ads at the bottom (2.15%).
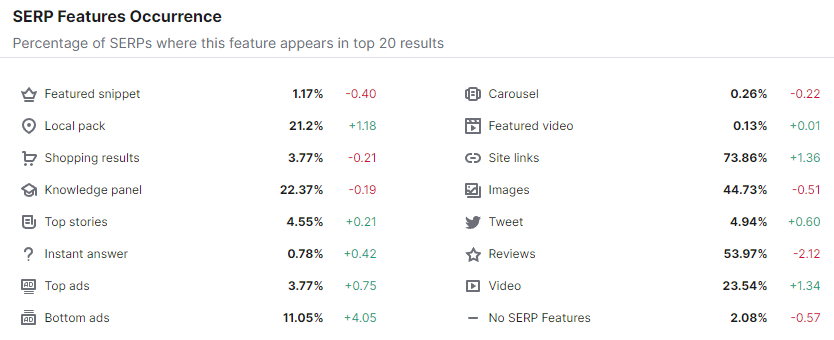
SERP Feature Appearance % for Business:
Business searches are almost identical to the average for all queries, in general. It may signify there are many topics that align with business concepts. With that said, there are far fewer Featured Snippets (1.17%) in Business searches most likely because Google deems the Featured Snippet as being an objective answer. Since there are so many competing thoughts and interests in business, perhaps less single answers in the featured snippet are warranted.
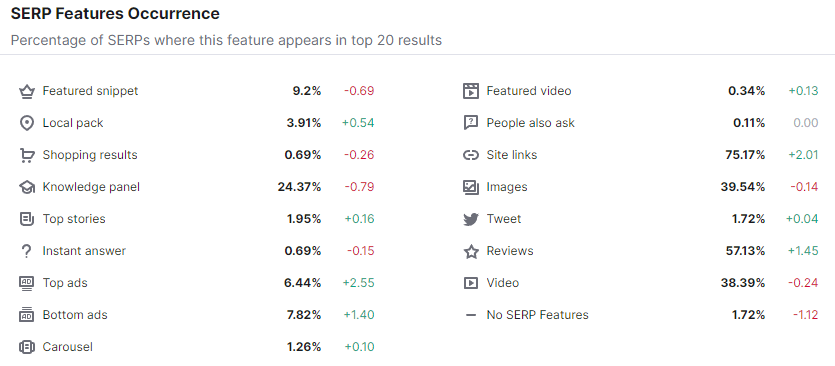
Computers & Electronics:
For the Computers & Electronics search space, you have significant amounts of google ads. These searches are the most populated when it comes to this SERP feature at 6.44% of the SERPs filled with ads at the top (at least). At the bottom of the SERP, they are below average at 7.82% of the SERPs having ads at after all the organic.
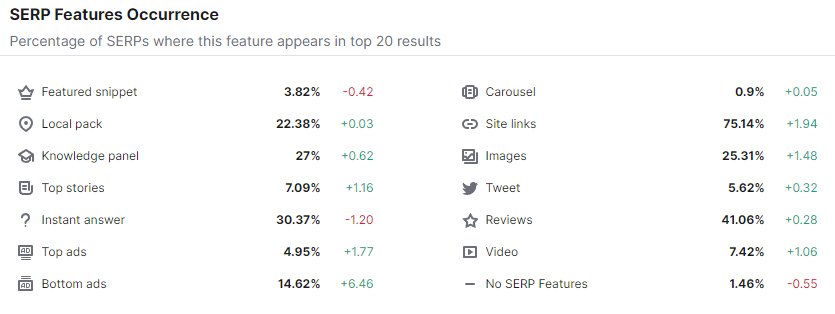
SERP Feature Occurrence % for Finance:
Finance searches dominate with the instant answers. They have the highest concentration of Instant Answers according to SEMRush’s Sensor. With 30.37% of the finance searches, an Instant Answer supposedly shows up. The average for all industries is 2.63%. So, this proportion is quite extreme.
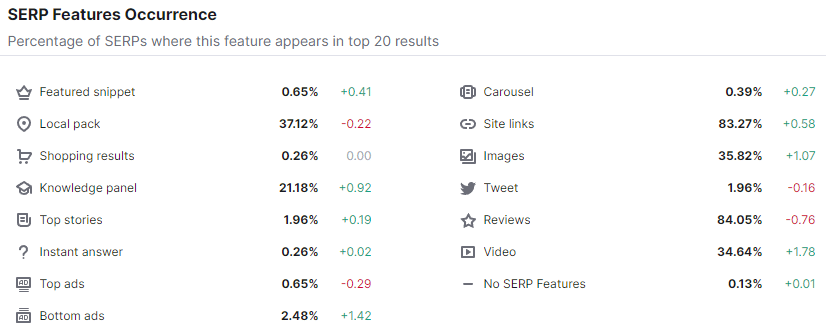
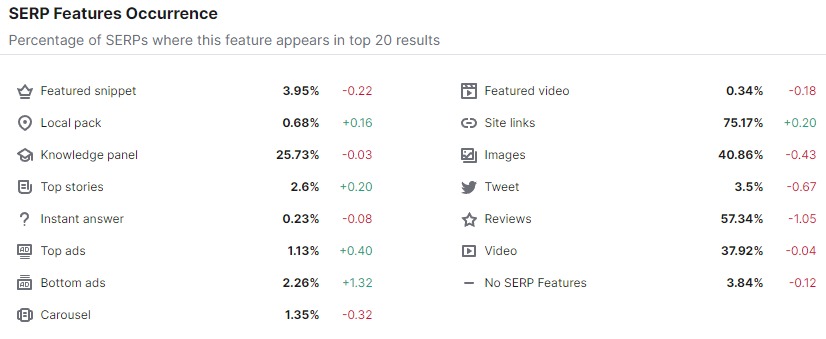
Food & Beverage:
More than 84% of the searches for food and drinks have a review SERP feature – 84.05% to be exact which makes it the highest percentage vs. the other 24 categories we examine today. The food & beverage searches do have most interesting SERPs though because they are the least populated with no SERP features at all with only 0.13% of this category of search not having any of these more unique results.
SERP Feature Frequency % for Games:
With gaming searches, there are rarely local pack results — they rank at the bottom with only 0.68% of the searches with local pack results. Not a lot of “games near me” I guess? They also have a low percentage of instant answers at 0.23% occupying an instant answer SERP feature.
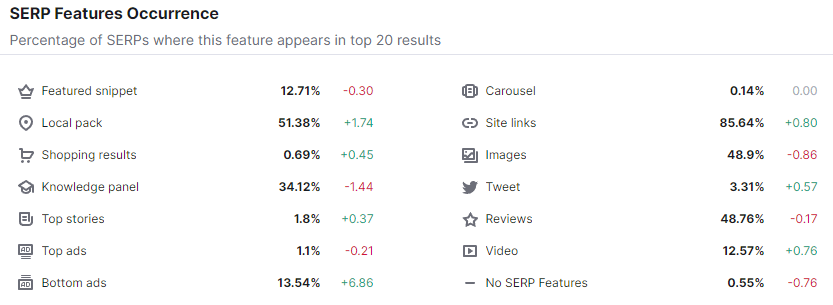
Health SERPs:
In terms of Health searches, they have the most local pack results — above Beauty & Fitness at 51.38% of the searches having local pack results. They also have less than half the norm of the Top Stories SERP feature with also about half the Google ads at the top and slightly lower than the norm for ads at the bottom of the SERP.
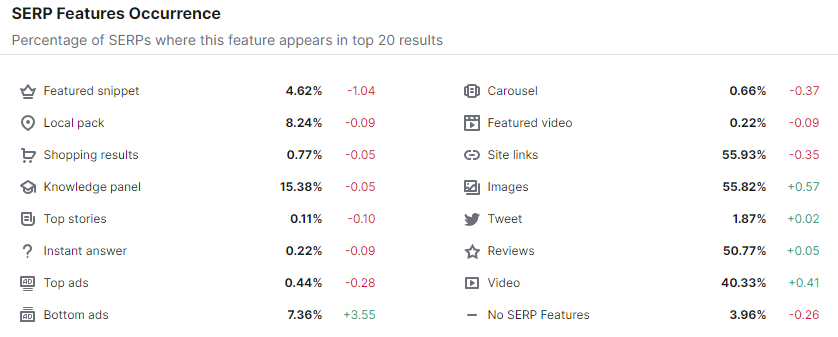
Hobbies & Leisure:
Hobbies and leisure searches have a dearth of Top Stories at 0.11% of the total SERPs occupied. They rank at the bottom with these SERP features along with having the lowest site links percentage in the various SERP categories (55.93%). They do have the highest Video SERP features percentage, however, at 40.33% of these searches having a video in their SERPs.
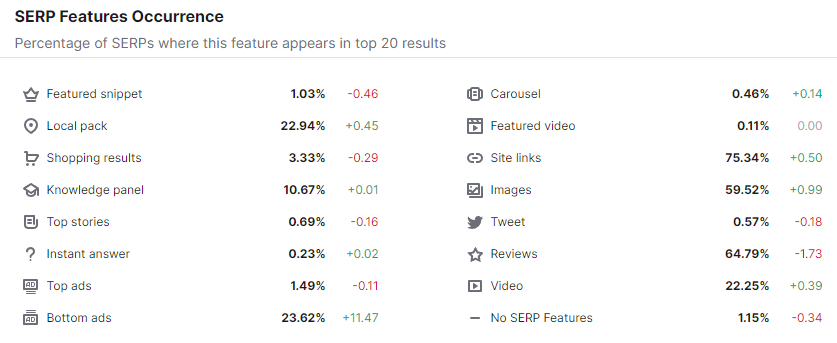
Home & Garden:
Home & Garden searches are at the top of shopping results (3.33%), ads at the bottom (whopping 23.62%) and images (59.52%) in terms of SERP features. These types of searches though are at the bottom of the Knowledge Panel & Featured Video SERP features with 10.67% and 0.11% respectively.
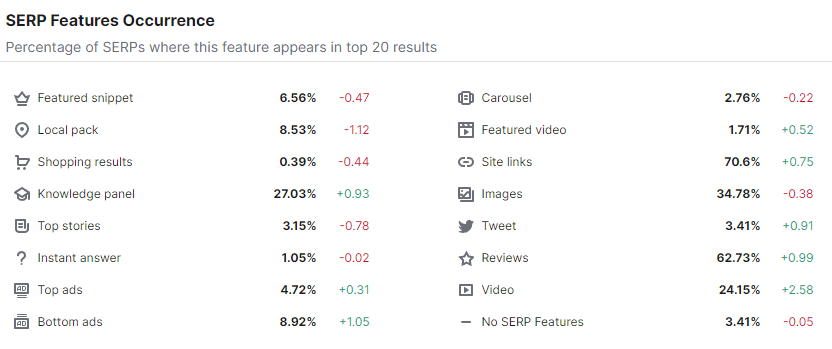
Internet & Telecommunications:
Another category that has a lot of Google ads is the Internet & telecommunications related searches. They rank 2nd behind PC & Electronics which is obviously a very similar industry. Close to 5% of the searches have an ad by Google. They also rank at the top of the carousels (2.76%) and Featured Videos (1.71%). Coincidentally, the “carousels” were the impetus of this entire set of data being collected. We were noticing that the carousels were changing to potentially accordion SERP features (or the like). We might even call them the Item List SERP feature which appears to be their structured data label.
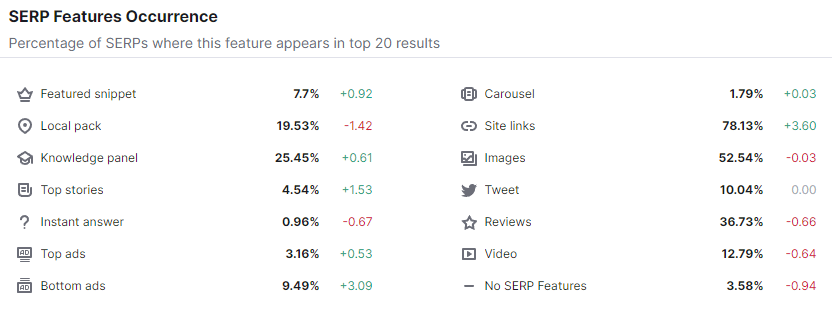
Jobs & Education:
The jobs and education searches mimic the norm, but they do have a few differences. The number of video SERP features are about 1/2 the average at 12.79%. There are also more than double the Tweet results in these types of searches at 10.04% of the searches. And less than half the norm of 2.63% (0.96% to be exact) of these types of searches have instant answers.
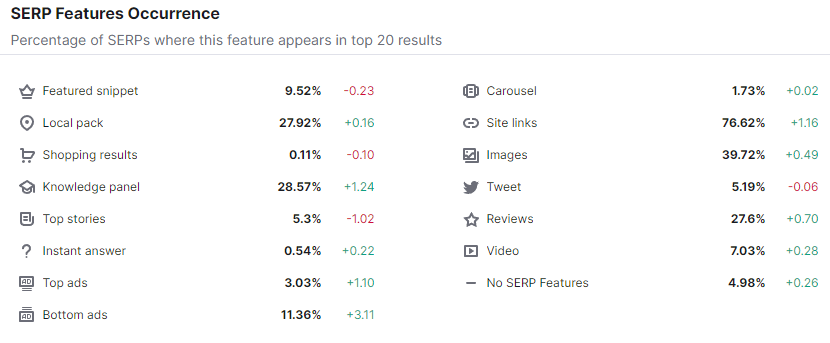
Law & Government:
Law & Government searches have the least number of shopping results, as logic would dictate at 0.11% of the searches in this category pulling up these ecommerce SERP feature. Also, a small percentage (0.54%) vs. the average of 2.63% have instant answers. A smaller number of these SERPs in this category also are filled with videos at 7.03% in contrast to the 23.66% across all sectors.
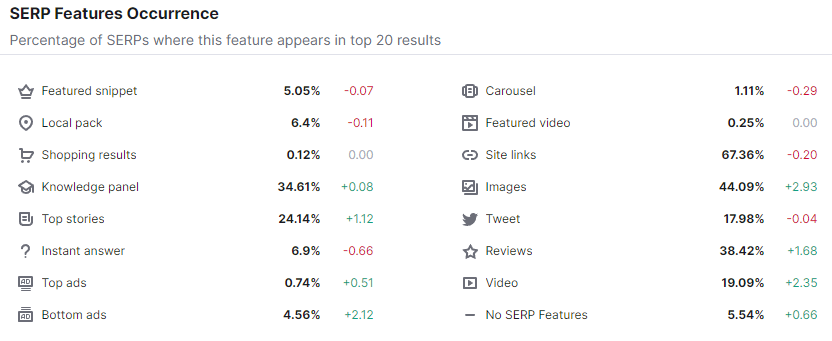
SERP Feature Appearance % for News:
To no one’s surprise, News searches occupy the highest amount of Top Stories SERP features at 24.14% having this. And they also occupy the second highest percentage of Tweets as well at 17.98%.
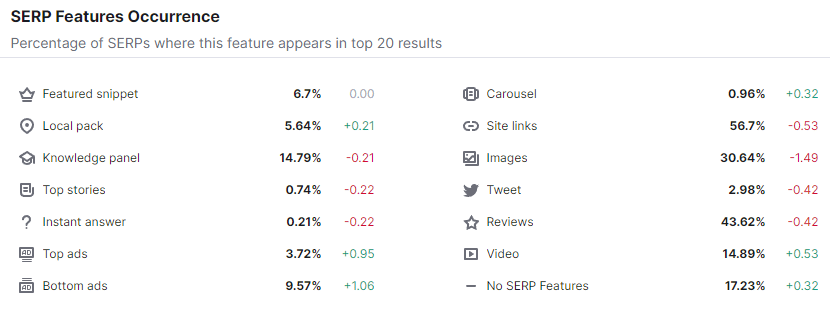
Online Communities:
With Online Community searches, many of them don’t have anything special in terms of SERP features — to be specific, 17.23% have no SERP features at al. This category also has the least Instant Answers at 0.21%.
People & Society:
With People & Society searches, there is a high volume of Featured Snippets. At the highest of all categories next to Science, this category has 15.19% of its SERPs filled with Featured Snippets. Surprisingly, there are less than half the average of 4.01% having Top Stories in People & Society searches at 1.6%.
Pets & Animals:
Three types of SERP features are more common in Pets & Animal searches: People also ask (0.12%), Site Links (89.365%) and Images (56.99%). There are also a significant amount of Local Pack results in these animal related searches at 42.08%. Very few Top Stories sit in this category, however.
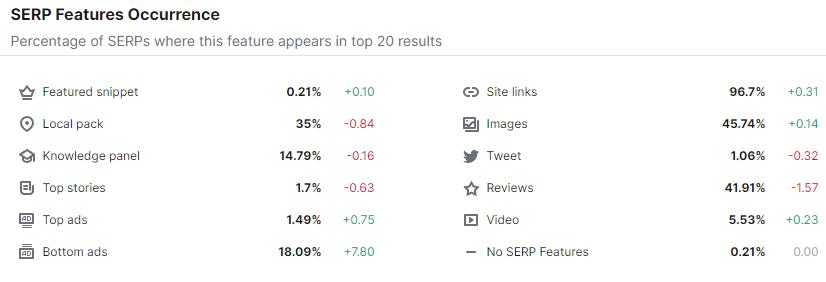
Real Estate SERPs:
Real Estate searches rank at the bottom of 2 categories: Featured Snippets (0.21%) & Videos (5.53%). They are at the top of the presence of Google Ads at the bottom of the page (18.09%) and Site Links with almost complete visibility, but specifically at 96.7% of the SERPs.
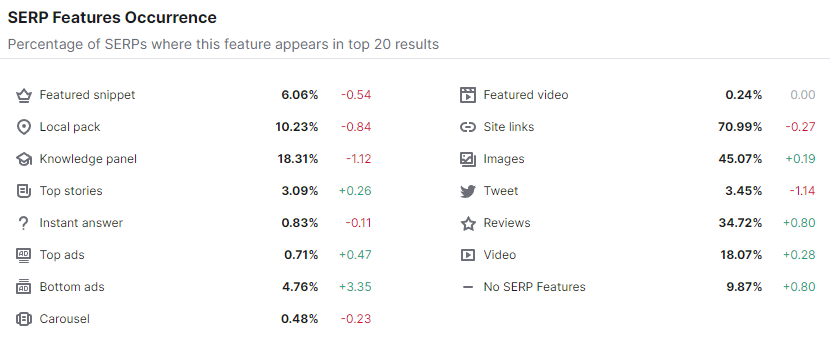
SERP Feature Occurrence % for Reference:
The Reference category doesn’t sit at the top for any of these features, but half less than the average of Instant Answers at 0.83% & there is also a dearth of ads at the top with only 0.71% having Google ads above the fold. There are 1/2 the average at 4.76% at the bottom as well. They are slightly below the averages for most of the SERP features, but do resemble the average for most of the categories overall.
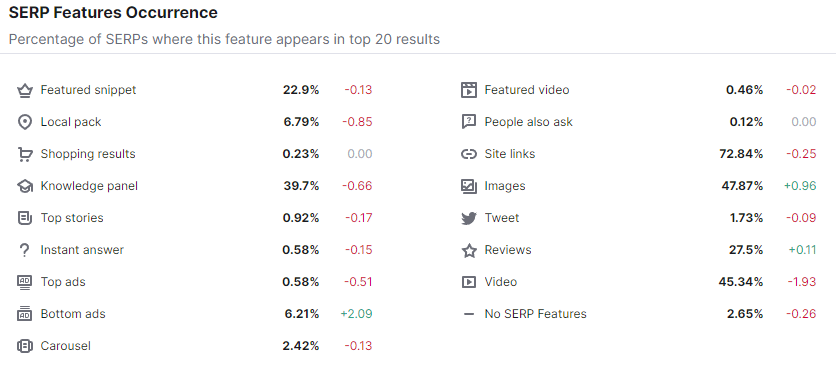
Science SERPs:
The Science category of searches has 4 SERP features that show up quite a bit comparatively: Featured Snippet (22.9%), Carousels (2.42%), People also ask (0.12%) and Videos (45.32%).
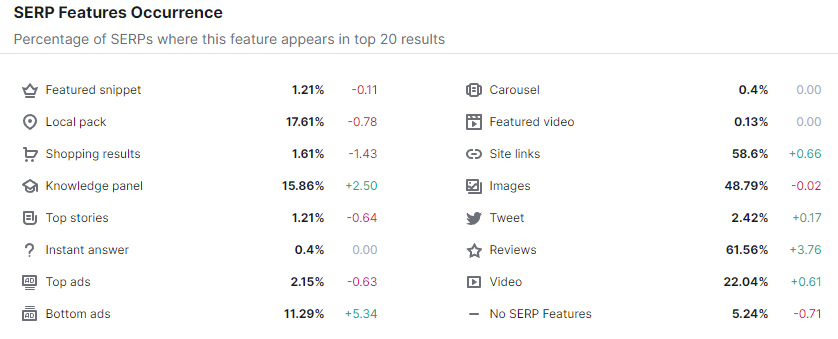
Shopping & Ecommerce:
Another category that doesn’t top other categories per se is shopping related searches. There are far fewer than most categories when it comes to Featured Snippets with only 1.21% of the ecommerce searches having these. Surprisingly, they are not at the top with “Shopping Results” and have 1.61% with these types of SERP features vs. Home & Garden and Business and Industry which both top 3% and Business approaching 4%.
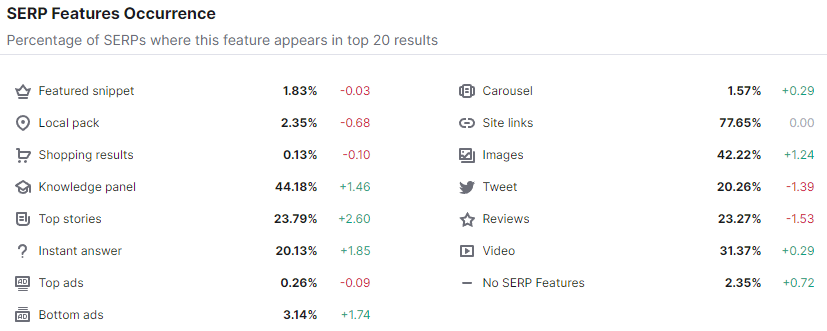
SERP Feature Frequency % for Sports:
Sports searches have a ton of Knowledge panel results (44.18%), many top stories SERP features (23.79%) and Instant Answers (20.13%) and Tweets (20.26%). Sports queries do have fewer ads and are at the bottom with only 0.26% having Google ads at the top and only 23.27% of the sports SERPs having reviews.
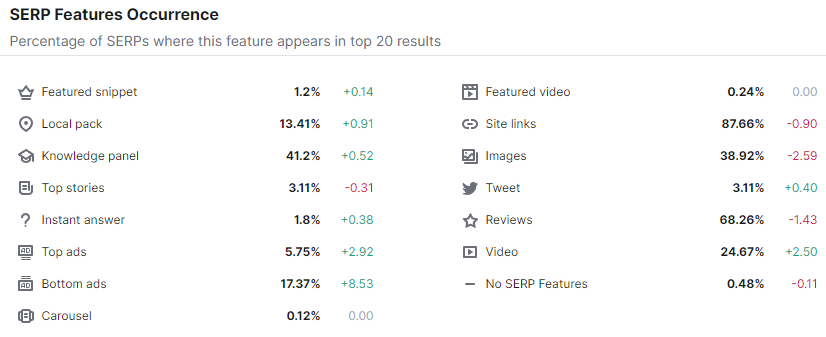
Travel SERPs:
Lastly, the travel searches tracked by SEMRush Sensor have the HIGHEST amount of Google ads with 5.75% of the total searches containing a Google ad. On the converse, there are only 0.12% of the SERPs that have carousels when people search travel terms. A lot of knowledge panel results pop up with 41.2% of the searches showing this along with more supporting a lot is spent on Google ads by having almost twice the average of ads below the fold at the bottom — specifically 17.37%.