Is it the damn Gecko?
While insurance companies like Geico spend a ton and in 2021, you could say the “gecko” was in the Top 100, but not here in 2022 (with our latest update). Instead, the top spender is not a huge surprise and continues to be the top spender for many years.
Also, if you search “top spenders on google ads“, there’s a chance you’ll get a very old article by AdAge from 2013. You may even get many other stats or outdated infographics (including possibly the most overused one by Wordstream in 2011 which we’ll share below). The good news about the AdAge piece is that the information is accurate that Amazon tops the list, but how about the rest? And is the spend the same as 2013? We found it changed literally in just one year — so, what do you think happened in 8 years? Well, in order to make sure you have the latest info, we decided to do the research and provide it to you!
With our latest update here in November 2022, a newer AdAge piece has entered the SERP, but it looks to be behind a paywall. So, our report ends up being very handy for all of you out there who may have smaller budgets. Free isn’t bad, right?
Looking for help from Seattle’s #1 SEO Agency? Send us an inquiry on our contact form!
With that said, here’s the latest data from our friends at SpyFu here in 2022 regarding the many companies who know the benefits of SEM:
Updated for 2024: The Top Google Ads Spenders in 2026
Top 100 Google Ads Spends Per Month
|
Rank
|
Domain
|
Ad Budget
|
Seo Clicks
|
|
|
1
|
$22M
|
3.68B
|
||
|
2
|
$18M
|
1.8B
|
||
|
3
|
$16.5M
|
463k
|
||
|
4
|
$6.35M
|
164k
|
||
|
5
|
$5.82M
|
257M
|
||
|
6
|
$5.82M
|
3.03
|
||
|
7
|
$5.52M
|
7.44M
|
||
|
8
|
$5.47M
|
805M
|
||
|
9
|
$5.44M
|
177M
|
||
|
10
|
$4.92M
|
751M
|
||
|
11
|
$4.91M
|
139
|
||
|
12
|
$4.43M
|
6.85M
|
||
|
13
|
$4.31M
|
463
|
||
|
14
|
$4.24M
|
14.3M
|
||
|
15
|
$4M
|
7.84M
|
||
|
16
|
$3.86M
|
147
|
||
|
17
|
$3.75M
|
102M
|
||
|
18
|
$3.46M
|
204M
|
||
|
19
|
$3.41M
|
6.15
|
||
|
20
|
$3.32M
|
452
|
||
|
21
|
$3.2M
|
245M
|
||
|
22
|
$3.18M
|
4.03M
|
||
|
23
|
$3.09M
|
720M
|
||
|
24
|
$3.07M
|
10.8
|
||
|
25
|
$3.06M
|
9.9M
|
||
|
26
|
$3.06M
|
7.54M
|
||
|
27
|
$3.04M
|
20.3M
|
||
|
28
|
$3.01M
|
234k
|
||
|
29
|
$2.98M
|
2.3M
|
||
|
30
|
$2.92M
|
0
|
||
|
31
|
$2.87M
|
0
|
||
|
32
|
$2.81M
|
3.99M
|
||
|
33
|
$2.78M
|
15.2k
|
||
|
34
|
$2.67M
|
13.5M
|
||
|
35
|
$2.64M
|
1.68k
|
||
|
36
|
$2.64M
|
26.4M
|
||
|
37
|
$2.62M
|
67.9M
|
||
|
38
|
$2.58M
|
1.08M
|
||
|
39
|
$2.43M
|
136
|
||
|
40
|
$2.41M
|
43.5M
|
||
|
41
|
$2.4M
|
32.2M
|
||
|
42
|
$2.36M
|
599
|
||
|
43
|
$2.32M
|
554k
|
||
|
44
|
$2.3M
|
72.9M
|
||
|
45
|
$2.29M
|
9.57M
|
||
|
46
|
$2.22M
|
1.77k
|
||
|
47
|
$2.22M
|
2.66M
|
||
|
48
|
$2.21M
|
273k
|
||
|
49
|
$2.17M
|
111M
|
||
|
50
|
$2.14M
|
14.8M
|
||
|
51
|
$2.11M
|
5.2M
|
||
|
52
|
$2.11M
|
1.65M
|
||
|
53
|
$2.1M
|
10.9M
|
||
|
54
|
$2.07M
|
285k
|
||
|
55
|
$2.07M
|
1.21
|
||
|
56
|
$2.06M
|
565
|
||
|
57
|
$2.05M
|
4.69M
|
||
|
58
|
$2.05M
|
145M
|
||
|
59
|
$2.03M
|
1.13M
|
||
|
60
|
$1.99M
|
415k
|
||
|
61
|
$1.99M
|
587M
|
||
|
62
|
$1.98M
|
618M
|
||
|
63
|
$1.95M
|
13.1k
|
||
|
64
|
$1.94M
|
0
|
||
|
65
|
$1.92M
|
0
|
||
|
66
|
$1.92M
|
6.83M
|
||
|
67
|
$1.9M
|
814
|
||
|
68
|
$1.87M
|
29.3M
|
||
|
69
|
$1.84M
|
316M
|
||
|
70
|
$1.83M
|
51.3
|
||
|
71
|
$1.82M
|
0.03
|
||
|
72
|
$1.79M
|
0.65
|
||
|
73
|
$1.74M
|
16.8M
|
||
|
74
|
$1.74M
|
6.12M
|
||
|
75
|
$1.68M
|
76.7M
|
||
|
76
|
$1.6M
|
176k
|
||
|
77
|
$1.58M
|
1.48k
|
||
|
78
|
$1.55M
|
12.6
|
||
|
79
|
$1.55M
|
552
|
||
|
80
|
$1.55M
|
8.64M
|
||
|
81
|
$1.53M
|
8.85M
|
||
|
82
|
$1.53M
|
565k
|
||
|
83
|
$1.52M
|
3.71M
|
||
|
84
|
$1.51M
|
862k
|
||
|
85
|
$1.49M
|
210M
|
||
|
86
|
$1.48M
|
23.1M
|
||
|
87
|
$1.47M
|
0
|
||
|
88
|
$1.46M
|
15.9M
|
||
|
89
|
$1.43M
|
3.17M
|
||
|
90
|
$1.43M
|
948
|
||
|
91
|
$1.42M
|
45.2M
|
||
|
92
|
$1.41M
|
388k
|
||
|
93
|
$1.41M
|
22.2M
|
||
|
94
|
$1.39M
|
123k
|
||
|
95
|
$1.39M
|
19.7M
|
||
|
96
|
$1.39M
|
6.48M
|
||
|
97
|
$1.38M
|
17.3M
|
||
|
98
|
$1.38M
|
117M
|
||
|
99
|
$1.37M
|
214k
|
||
|
100
|
$1.36M
|
8.56k
|
You may be interested in the 17 Key Benefits of SEM that will Surprise You!
And for history’s sake, we are keeping last year’s list here for reference. Some of the key differences you’ll see include:
- Amazon appears to have increased spending by $5 million/mo
- Ironically, Google has shot up very high up the list to #2 outspending what Amazon did per month last year
- Most of the top spenders have remained the same, but travel has become more competitive. Look at who’s #5 today.
Updated for 2024: The Top Google Ads Spenders in 2026
2021’s 100 Biggest Google Ads Spenders Per Month
| Rank | Domain | Ad Budget* | Seo Clicks |
| 1 | amazon.com | $17.4M | 3.37B |
| 2 | info.com | $12.9M | 29.9k |
| 3 | consumersadvocate.org | $7.01M | 555k |
| 4 | progressive.com | $5.78M | 3.89M |
| 5 | geico.com | $5.22M | 9.6M |
| 6 | ebay.com | $5.05M | 473M |
| 7 | wayfair.com | $5.02M | 198M |
| 8 | statefarm.com | $4.02M | 12.4M |
| 9 | fastquicksearch.com | $3.88M | 0 |
| 10 | walmart.com | $3.79M | 410M |
| 11 | homedepot.com | $3.79M | 504M |
| 12 | overstock.com | $3.71M | 50M |
| 13 | lendingtree.com | $3.5M | 3.32M |
| 14 | walletgenius.com | $3.44M | 2.4k |
| 15 | usautoinsurancenow.com | $3.43M | 7.46 |
| 16 | lowes.com | $3.36M | 130M |
| 17 | quoteble.com | $3.26M | 80.2 |
| 18 | insure.com | $3.17M | 1.5M |
| 19 | homeadvisor.com | $3.16M | 27.3M |
| 20 | carvana.com | $3.07M | 11.4M |
| 21 | thehartford.com | $2.98M | 2.33M |
| 22 | allstate.com | $2.9M | 10.3M |
| 23 | expedia.com | $2.87M | 308M |
| 24 | officialcarinsurance.com | $2.82M | 0.12 |
| 25 | nation.com | $2.75M | 2.61k |
| 26 | healthinfo.care | $2.69M | 0 |
| 27 | libertymutual.com | $2.67M | 2.54M |
| 28 | jcpenney.com | $2.64M | 31.4M |
| 29 | cargurus.com | $2.58M | 29.2M |
| 30 | amicacoverage.com | $2.56M | 7.76k |
| 31 | cheapest-auto-insurance.com | $2.49M | 6.47 |
| 32 | ratekick.com | $2.41M | 49.5 |
| 33 | priceline.com | $2.4M | 4.89M |
| 34 | insurance.com | $2.32M | 2.77M |
| 35 | top10.com | $2.29M | 162k |
| 36 | quickenloans.com | $2.26M | 6.01M |
| 37 | capitalone.com | $2.25M | 13.1M |
| 38 | findsimilar.com | $2.18M | 78.3 |
| 39 | bestreviews.com | $2.14M | 1.98M |
| 40 | quotewizard.com | $2.08M | 933k |
| 41 | target.com | $2.07M | 336M |
| 42 | thecarinsuranceguide.com | $2.05M | 227 |
| 43 | N/A | $2.02M | 973k |
| 44 | booking.com | $1.99M | 165M |
| 45 | aaa.com | $1.95M | 10.6M |
| 46 | truecar.com | $1.92M | 14.4M |
| 47 | att.com | $1.9M | 48.3M |
| 48 | bestdeals.today | $1.85M | 6.07k |
| 49 | insurify.com | $1.78M | 10M |
| 50 | pretected.com | $1.75M | 645 |
| 51 | kohls.com | $1.75M | 103M |
| 52 | gopher.com | $1.71M | 499 |
| 53 | phoenix.edu | $1.71M | 867k |
| 54 | cars.com | $1.67M | 115M |
| 55 | etsy.com | $1.63M | 196M |
| 56 | asu.edu | $1.61M | 4.35M |
| 57 | uline.com | $1.59M | 4.38M |
| 58 | wgu.edu | $1.57M | 2.03M |
| 59 | mapquest.com | $1.51M | 61.4M |
| 60 | kayak.com | $1.49M | 196M |
| 61 | autotrader.com | $1.46M | 56.4M |
| 62 | howstuffworks.com | $1.46M | 18.6M |
| 63 | creditkarma.com | $1.45M | 22.4M |
| 64 | nerdwallet.com | $1.44M | 88.1M |
| 65 | snhu.edu | $1.42M | 2.29M |
| 66 | devry.edu | $1.42M | 272k |
| 67 | consumeraffairs.com | $1.41M | 16.9M |
| 68 | healthnwell.com | $1.39M | 119 |
| 69 | experian.com | $1.34M | 8.62M |
| 70 | comparecards.com | $1.32M | 107k |
| 71 | hotels.com | $1.32M | 103M |
| 72 | thetop10sites.com | $1.32M | 1.34k |
| 73 | buyersguide.org | $1.31M | 1.6k |
| 74 | top10mortgageloans.com | $1.3M | 219 |
| 75 | fundinghero.com | $1.3M | 4.16k |
| 76 | liberty.edu | $1.3M | 6.63M |
| 77 | sureint.com | $1.28M | 0 |
| 78 | discovercard.com | $1.27M | 240k |
| 79 | grainger.com | $1.27M | 9.61M |
| 80 | joinroot.com | $1.26M | 304k |
| 81 | mattressfirm.com | $1.25M | 5.8M |
| 82 | supercheapinsurance.com | $1.24M | 0 |
| 83 | thumbtack.com | $1.23M | 9.41M |
| 84 | informationvine.com | $1.23M | 459 |
| 85 | bestmattressonline.org | $1.23M | 6.76k |
| 86 | chase.com | $1.19M | 18.2M |
| 87 | wix.com | $1.17M | 10.7M |
| 88 | pronto.com | $1.17M | 4.14k |
| 89 | bestreviews.guide | $1.17M | 797k |
| 90 | shopify.com | $1.17M | 36.8M |
| 91 | intuit.com | $1.16M | 23.9M |
| 92 | xfinity.com | $1.16M | 17.3M |
| 93 | farmers.com | $1.16M | 3.13M |
| 94 | gcu.edu | $1.15M | 629k |
| 95 | cheapcarinsuranceusa.com | $1.14M | 0 |
| 96 | reservations.com | $1.12M | 908k |
| 97 | everquote.com | $1.11M | 157k |
| 98 | discover.com | $1.1M | 5.1M |
| 99 | adt.com | $1.09M | 1.08M |
| 100 | simplisafe.com | $1.08M | 155k |
Looking for a PPC Agency in Seattle? We will be happy to help you garner immediate visibility in the many top websites that offer PPC or SEM Advertising.
And here’s more “historical data” which should hopefully NOT show up for recent requests for the biggest budgets by individual companies helping Google generate billions in revenue each quarter.
2013 Top Search Marketing Advertisers
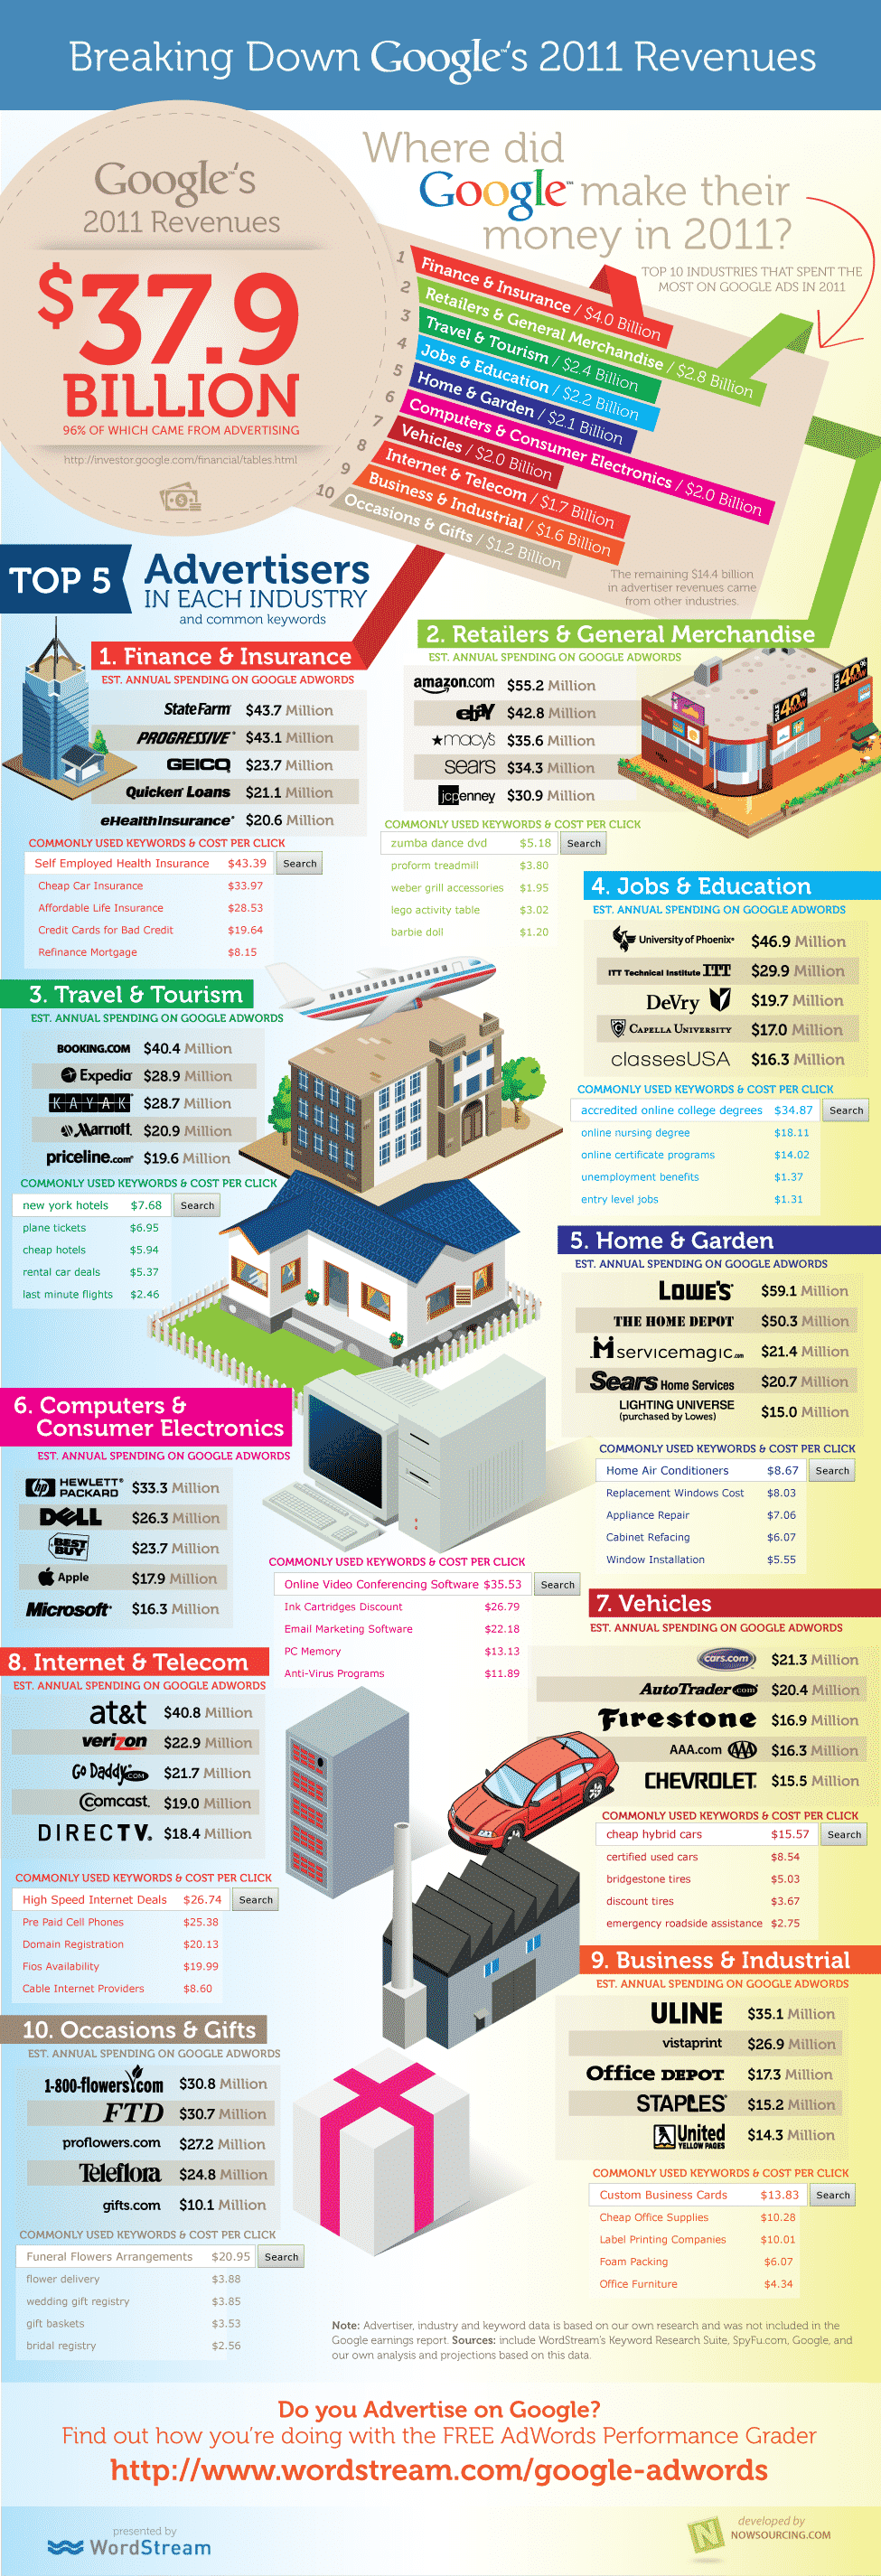
Sadly, but surely, data from an even older source shows up as the #2 result from wordstream (their 2011 study) for the same search “.top spenders on google ads:
Updated for 2024: The Top Google Ads Spenders in 2026
They reported:
2011 Top Google Ads Spenders by Industry
- Finance & Insurance ($4 billion)
- Retailers & General Merchandise ($2.8 bill)
- Travel & Tourism ($2.4 bill)
- Jobs & Education ($2.2 bill)
- Home & Garden ($2.1 bill)
- Computers & Consumers Electronics ($2.0 bill)
- Vehicles ($2.0 bill)
- Internet & Telecom ($1.7 bill)
- Business & Industrial ($1.6 bill)
- Occasions & Gifts ($1.2 bill)
Here’s the outdated infographic that shows up a lot for “top spenders on google adsâ€. Can’t believe it’s stuck around for more than a decade!