Popular Apps TL;DR
- The truth behind Apps Data
- Our Top (Google) Apps by usage
- SimilarWeb’s Top Apps Lists (for both Android and iOS)
“You can’t handle the truth” (about apps)
It’s been critical to me to understand the entire landscape when it comes to online marketing. You shouldn’t just do what everyone does (i.e., google ads or facebook ads). We should all truly try to assess which opportunities exist beyond “the talk.”
As a result, I’m constantly examining the ENTIRE landscape.
Understanding which websites have the largest desktop or web app usage is relatively clear. SimilarWeb has helped us define which sites could give us the best ROI for online advertising*:
Top US Websites by Usage

*This list obviously omits reference sites like Wikipedia or international sites like Baidu. The traffic should also be understood as “all traffic.” So, Google’s 88 bill/mo (now 90.89 bill/mo as of May 2021) is distributed:
- 26.6% USA
- 4.35% Brazil
- 4.18% India
- 4.07% United Kingdom
- 3.84% Japan (and so on)
Thus, it’s approximately 24.2 billion visits a month for Google by US users.
The Apps Space is a bit more confusing
The smartphone apps space has been harder to track down, but SimilarWeb is beginning to get into the game of helping us learn what’s being used (the most). The analytics company currently breaks it up by by operating system, by country, by category and cost.
With that said, we’ve noticed that some of the data isn’t matching up.
Their list doesn’t match the manual data pull we spent a few days looking at. As a result, we’ll publish both our list of top apps and their list as well. You can decide which one will be your source of truth.
Also, they require you to choose a country to pull the data (at least in the free version). The paid version costs a little over $1000/month. For free blogging that doesn’t generate us anything, but satisfaction in understanding information, we would need to be swimming in money for us to do this for more than just fun.
The Top 50 Apps (on Android)
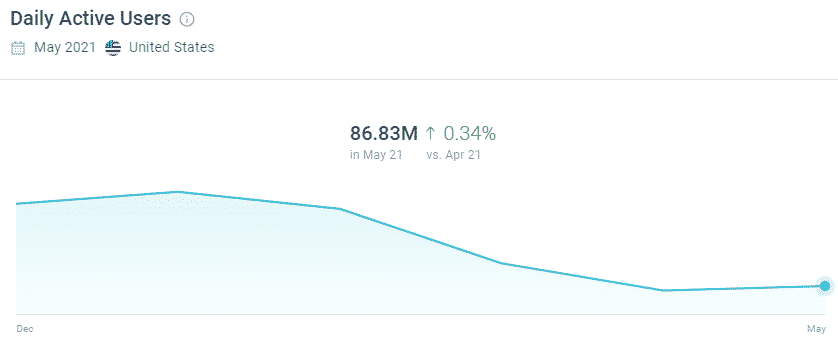
1. Google 86.83 Mill Users/Mo
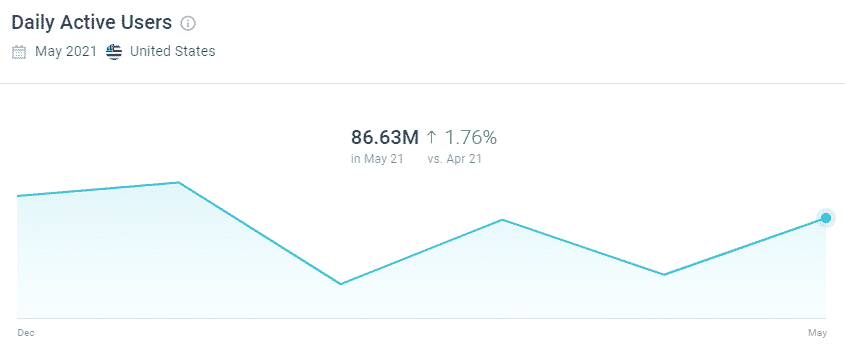
2. Google Chrome 86.63 mill/mo
3. Facebook 85.75 mill/mo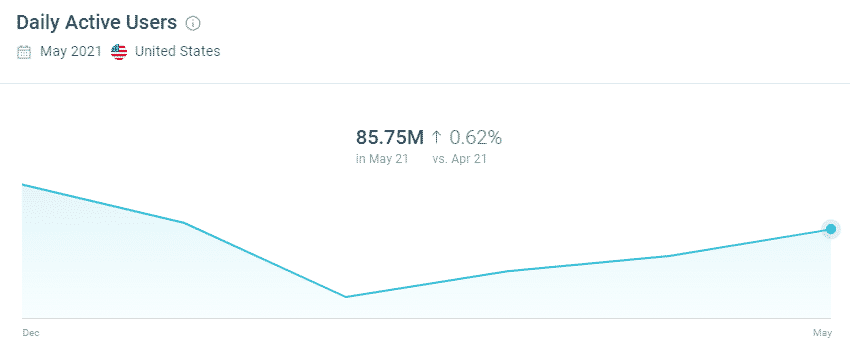
4. (FB) Messenger 69.68 mill/mo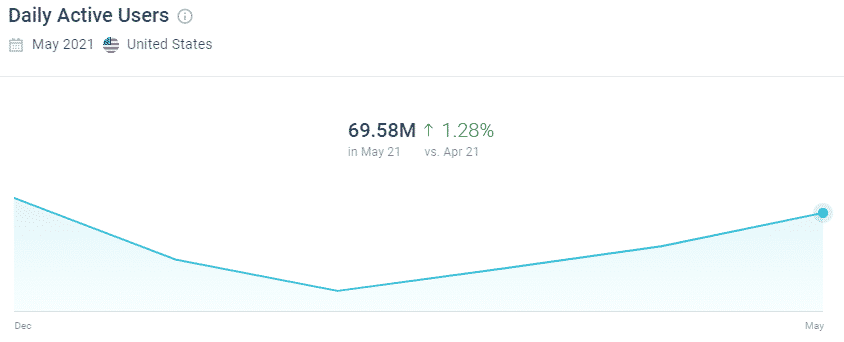
5. YouTube 60.78 mill/mo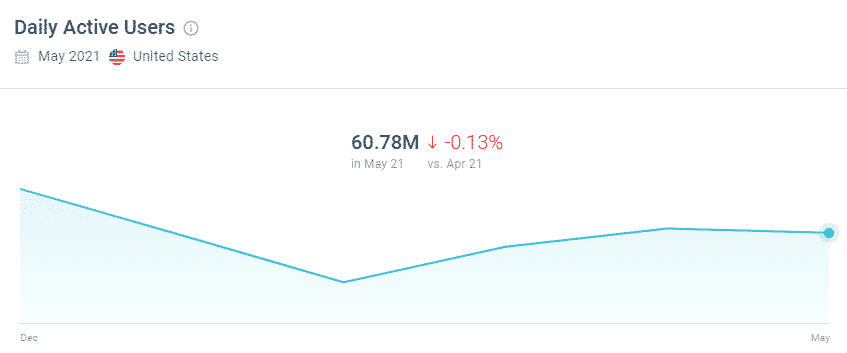
6. Gmail 44.54 mill/mo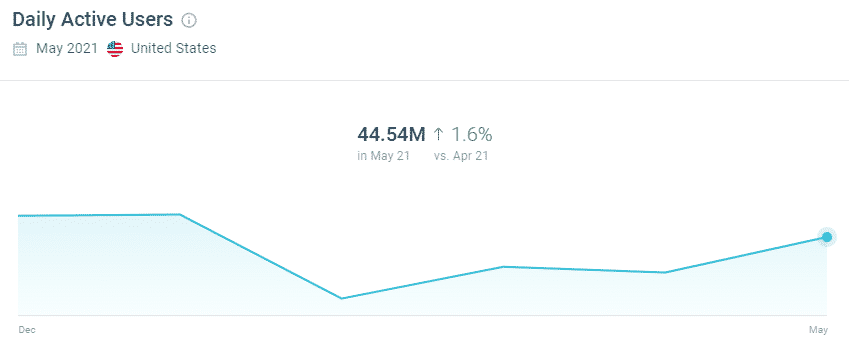
7. Instagram 32.45 mill/mo
8. Snapchat 29.73 mill/mo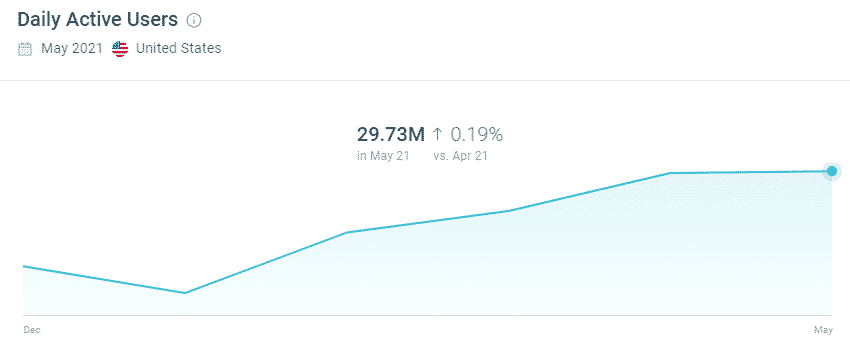
9. Google Duo – High Quality Video Calling 24.8 mill/mo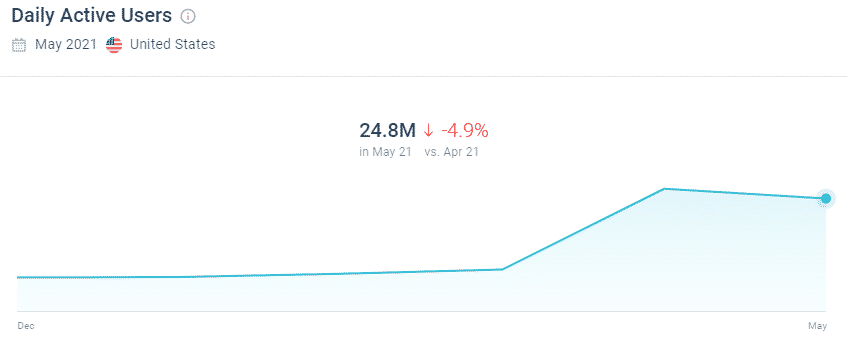
10. TikTok 24.08 mill/mo
11. Carrier Services by Google 23.47 mill/mo
12. Google Maps 22.29 mill/mo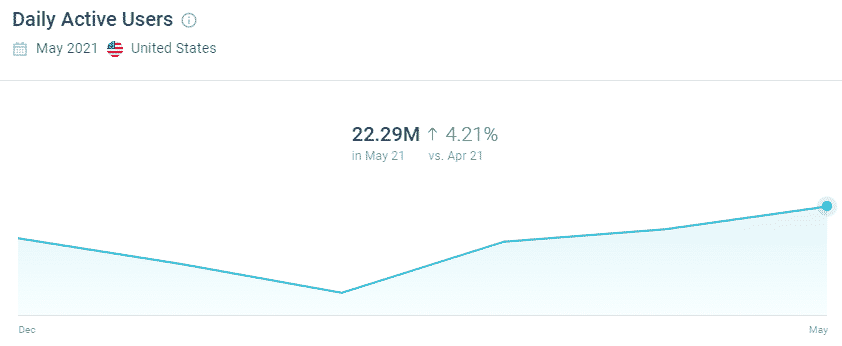
13. Messages by Google 22.06 mill/mo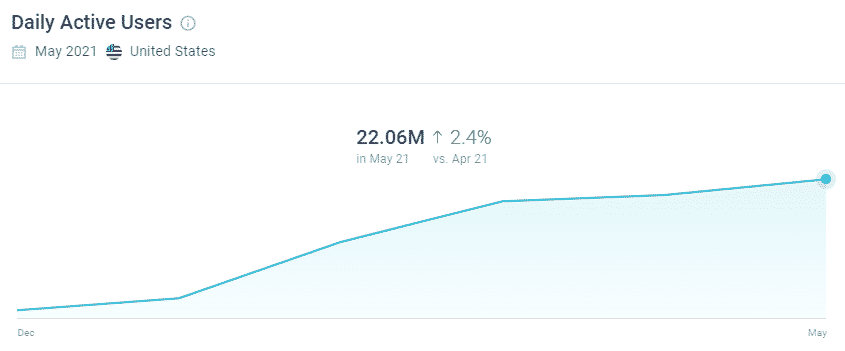
14. Google Photos 21.78 mill/mo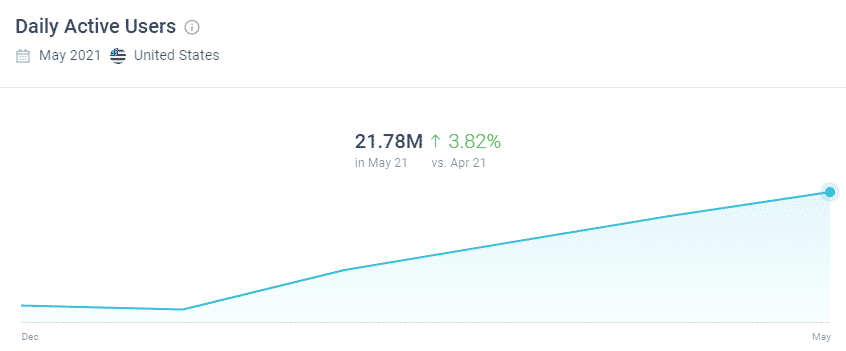
15. Spotify 18.97 mill/mo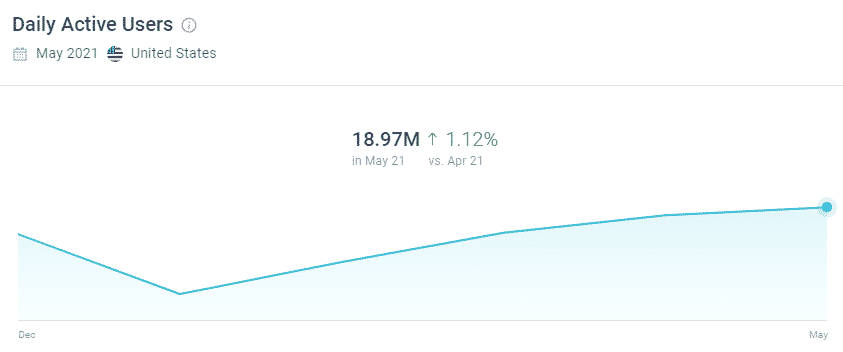
16. Samsung Internet Browser 18.87 mill/mo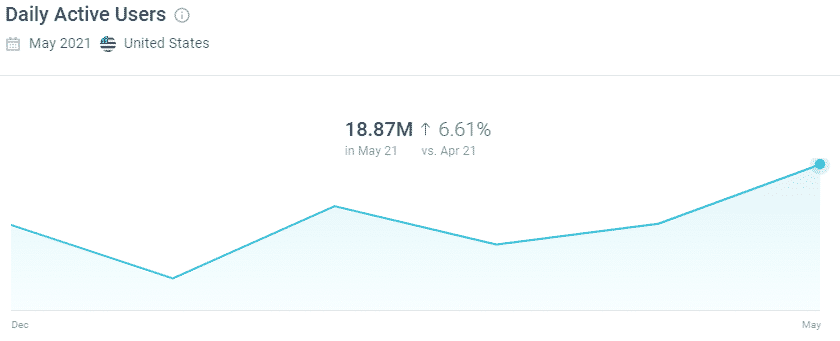
17. Amazon Shopping 17.08 mill/mo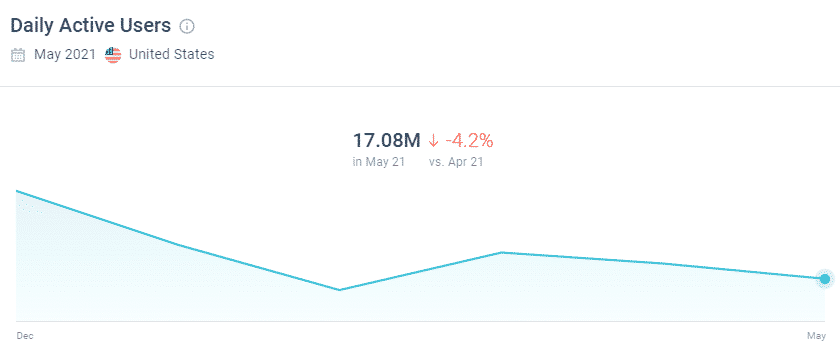
18. Yahoo Mail 16.19 mill/mo
19. Verizon Messages 15.6 mill/mo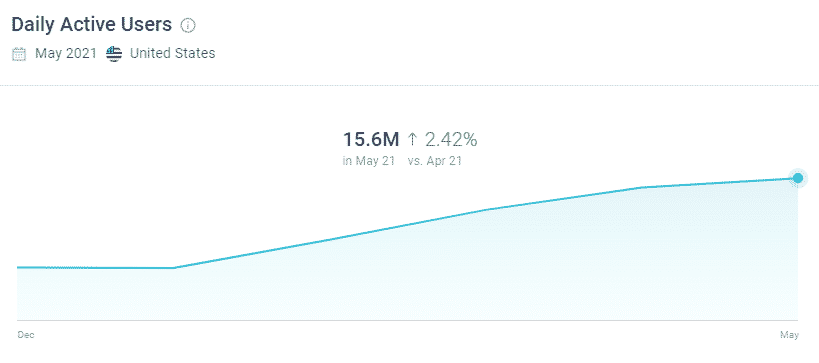
20. Whatsapp Messenger 15.01 mill/mo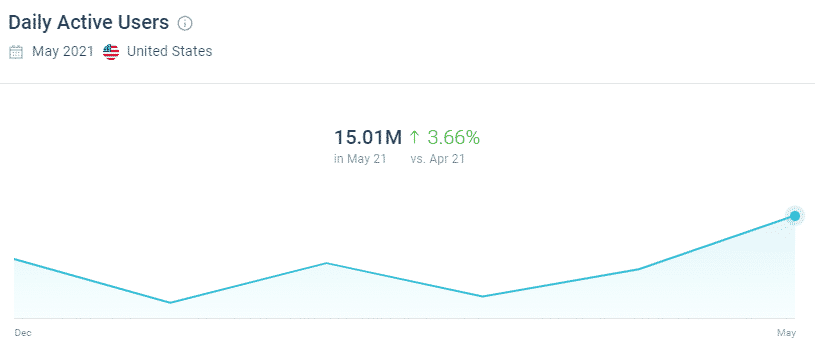
21. Google Play Services
21. Phone by Google (tied for 22nd)
23. News Break: Local Breaking Stories
24. Pixel Launcher![]()
25. Google Calendar
26. Samsung Health
27. Microsoft Outlook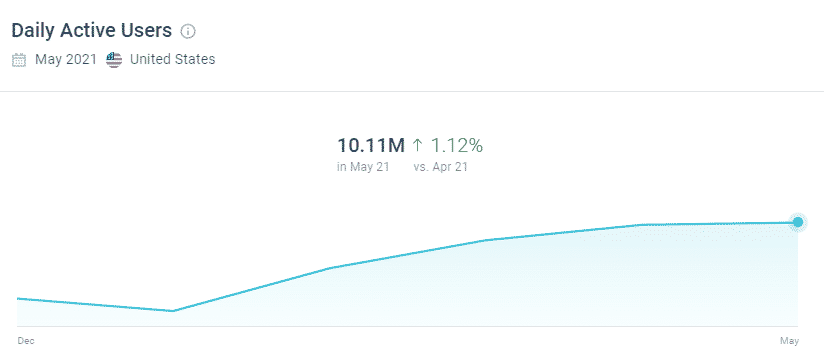
28. Pandora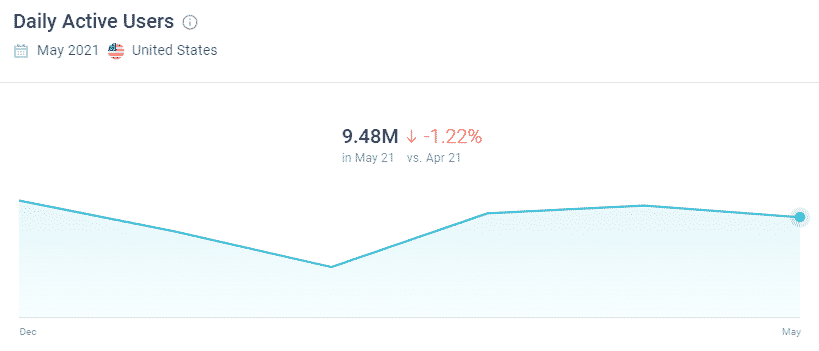
29. Gboard – Google’s Keyboard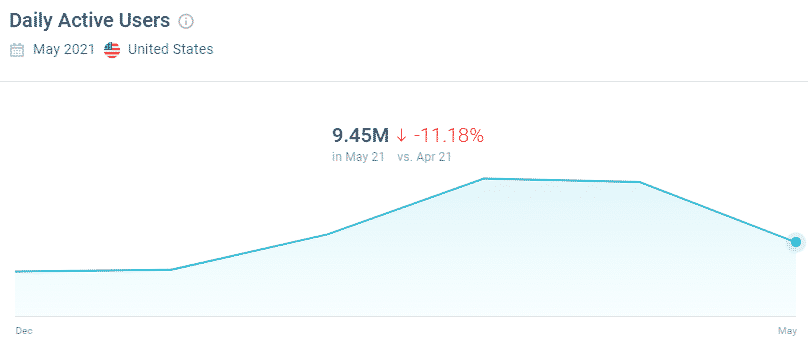
30. Google Drive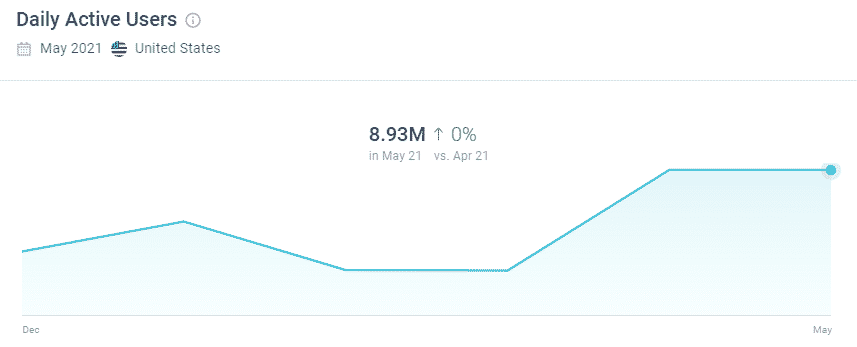
31. Twitter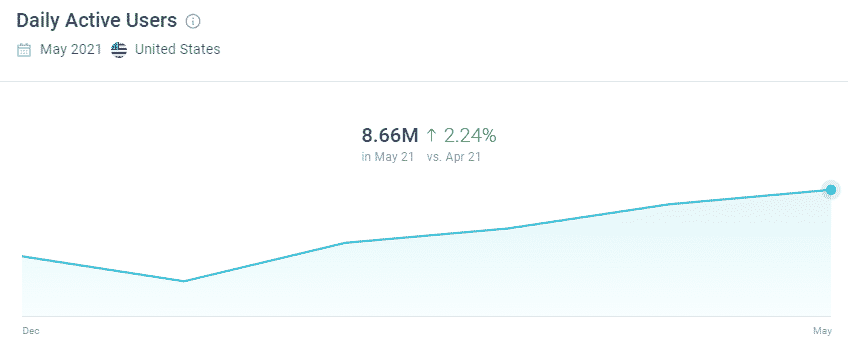
32. Verizon Call Filter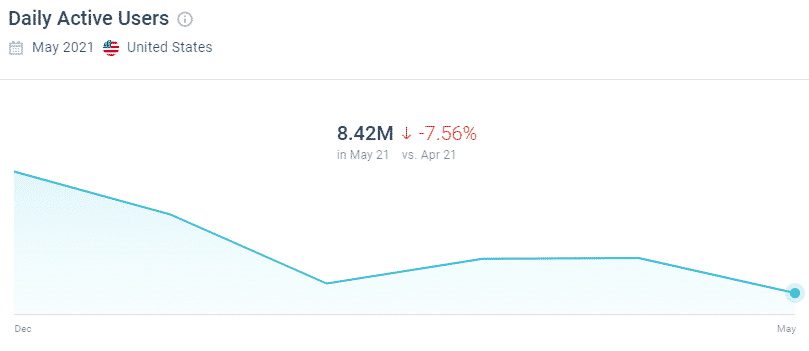
33. YouTube Music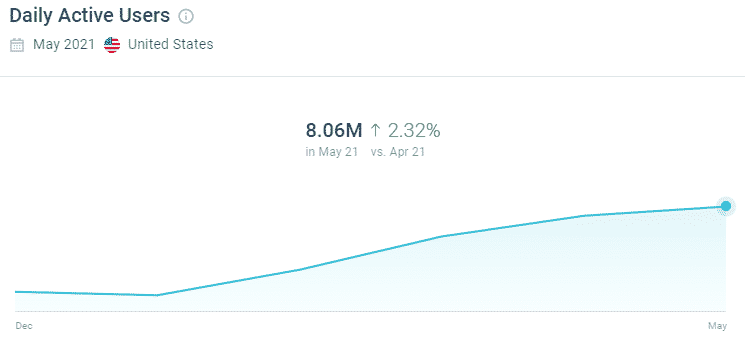
34. Samsung Email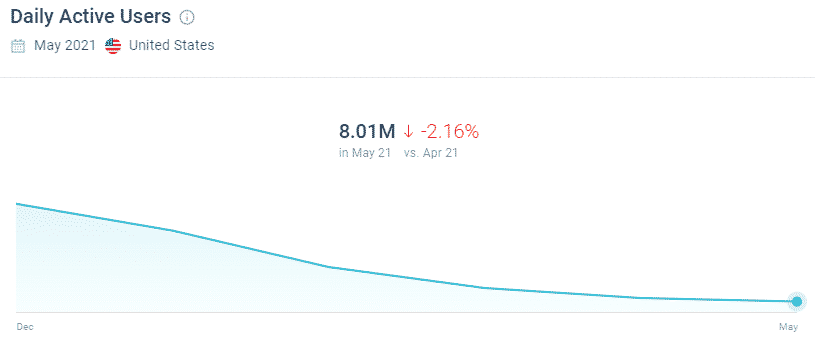
35. Netflix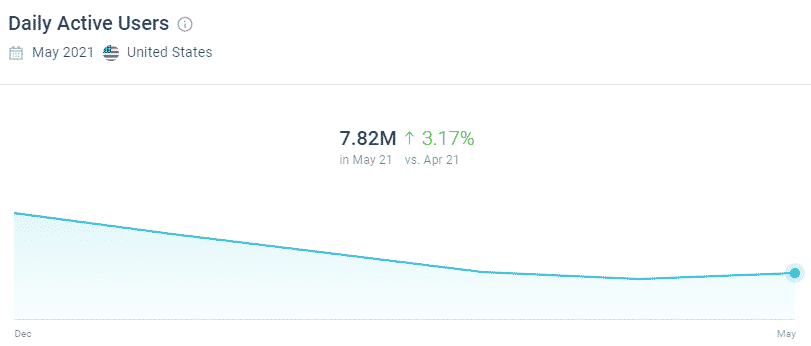
36. Discord
37. MetroZone by T-Mobile
38. Contacts by Google
39. Cash App
40. Microsoft OneDrive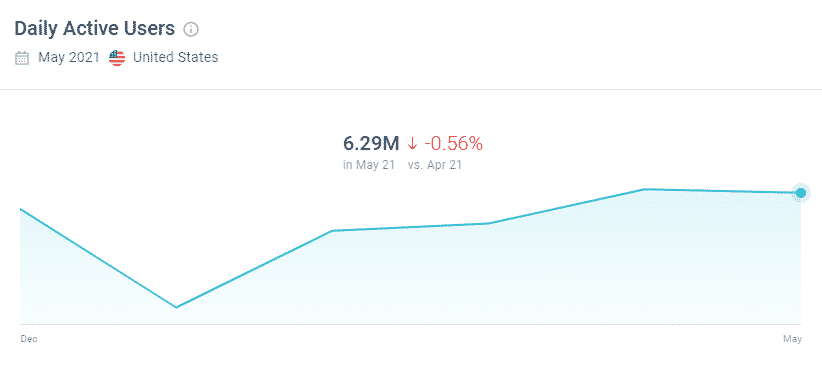
41. Amazon Music
42. Amazon Prime Video
43. Digital Secure by Verizon
44. Samsung Pay
45. Carrier Hub by Sprint
46. Reddit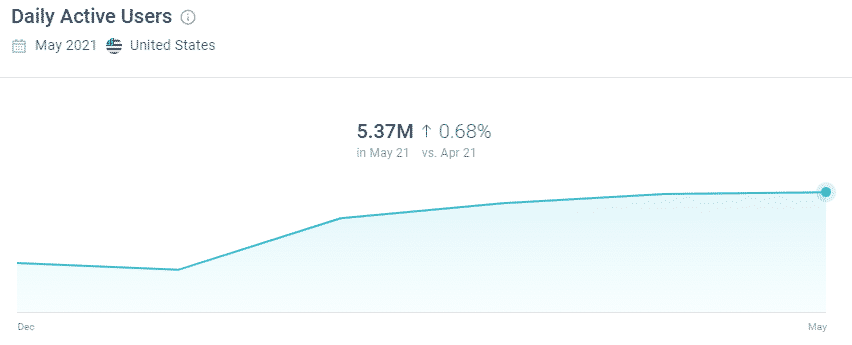
47. Pinterest
48. Samsung Calculator
49. Walmart Shopping
50. Galaxy Wearable
**Again, this is for the US only
If Microsoft was targeted for Anti-trust, these numbers might be interesting evidence against Alphabet. Seems a little odd that all these non-Google branded apps who are made by Google dominate the top usage list.
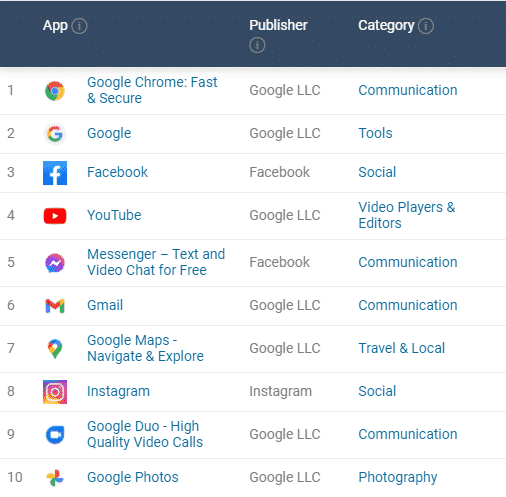
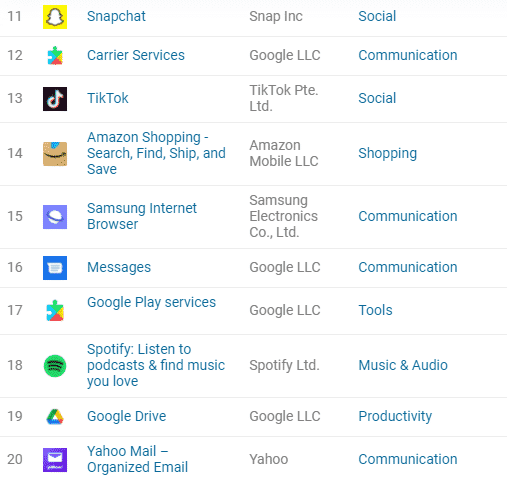
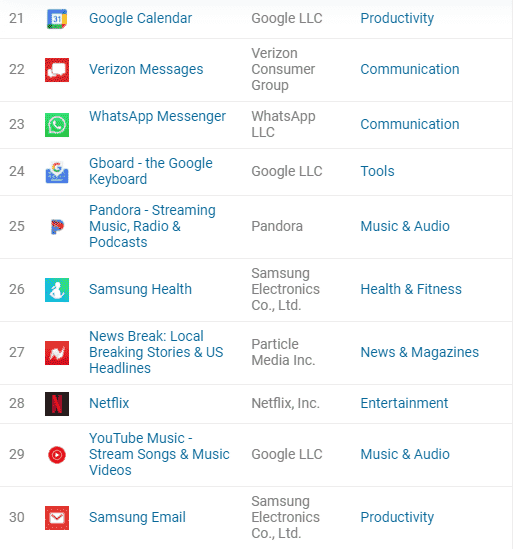
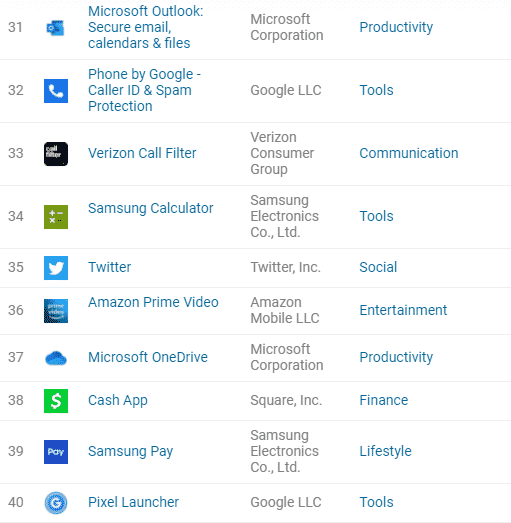
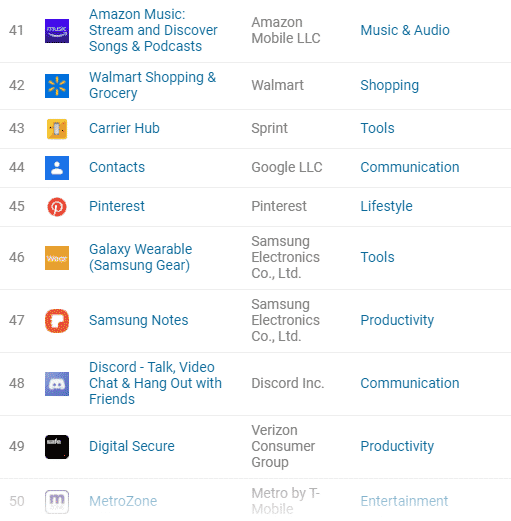
The Top 50 Google Apps (June 2021)
Despite our manual survey results, SimilarWeb still ranks the Top 50 by country and operating system. So, here are the ones they ranked as the Top 50:
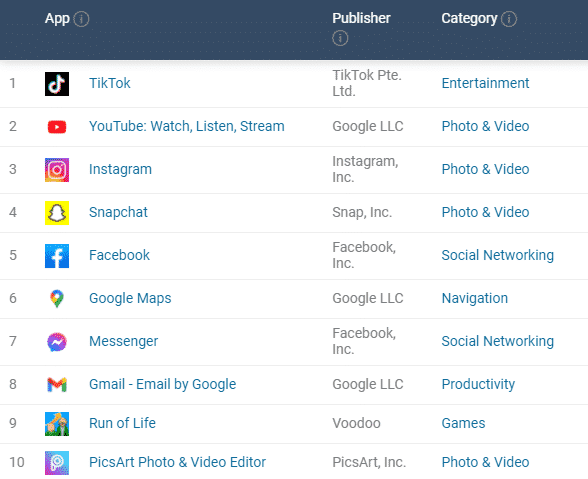
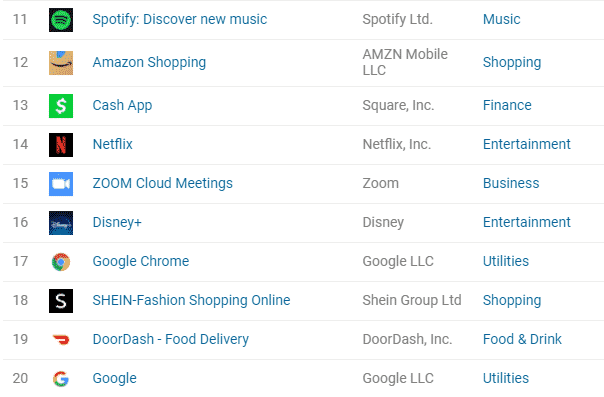
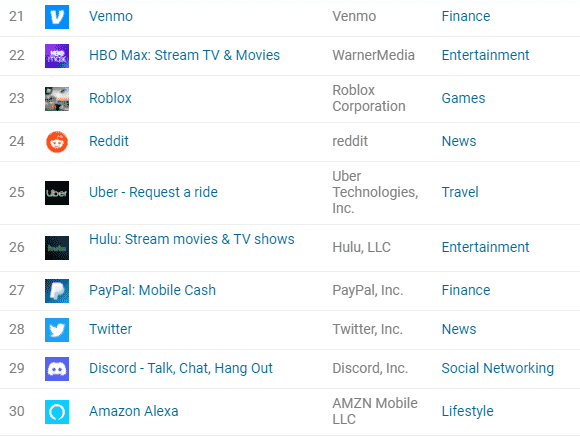
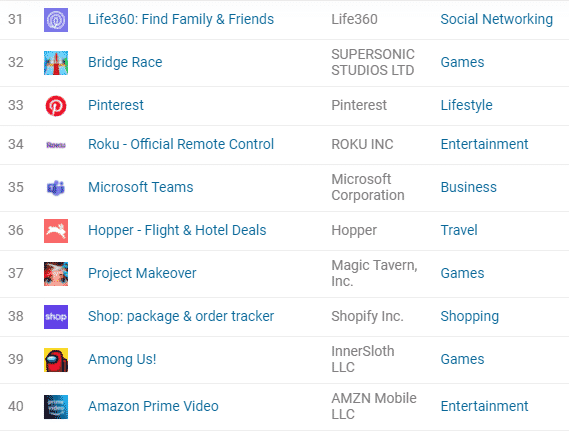
Top Apps on the Apple Store (USA)
As we mentioned, SimilarWeb breaks it up by operating system. So, here are the top apps on iPhones: