
Top Websites by UNIQUE USERS
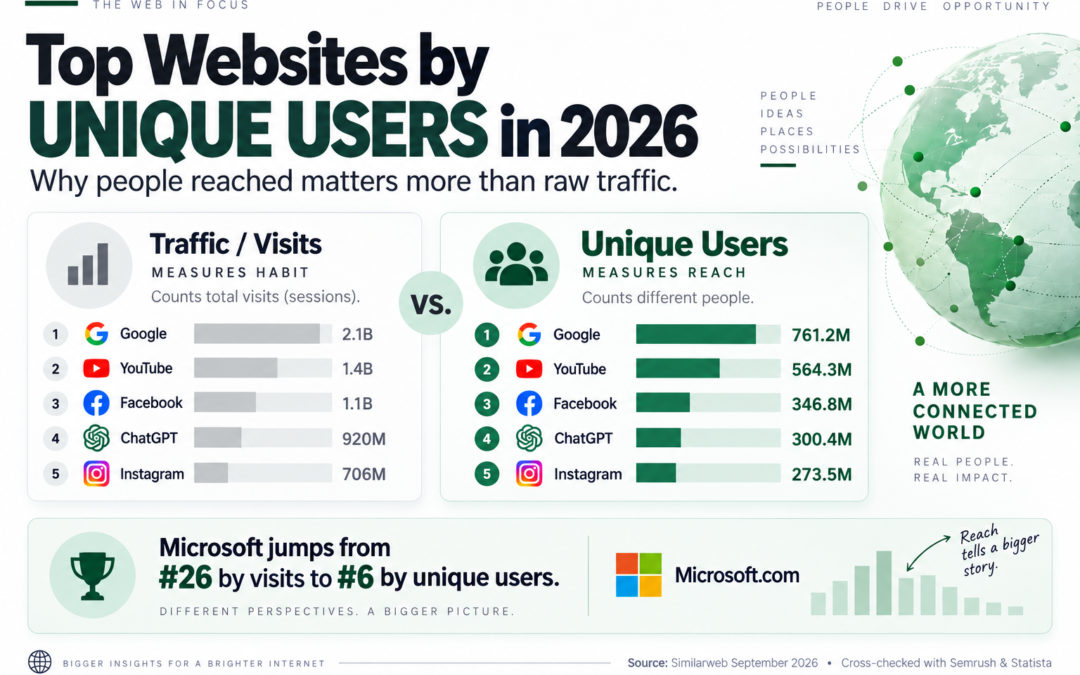
Microsoft.com is the 26th most-visited website on Earth. Count people instead of visits, and it jumps to #6, ahead of WhatsApp, Reddit, and Amazon.
That one flip explains why most “top websites” lists quietly mislead you. They rank by visits, and visits reward habit. Someone who checks Google 44 times a month counts 44 times. A site that 260 million different people each use once or twice to download a driver or find a support page barely registers.
This report ranks the world’s biggest websites by unique visitors: how many different people actually showed up in a month. It is built from Similarweb’s September 2026 data covering the 100 highest-traffic domains in its 10,000-domain ranking, cross-checked against Semrush’s public Top Websites ranking and Statista’s unique-visitor rankings. We also grouped all 100 sites into categories to see which parts of the web grew and which shrank, and pulled out ten trends worth knowing. Then we get to the part that matters if you run a business in Seattle or anywhere else: what these numbers say about where your customers spend their attention.

The Short Version
Google reaches the most people (761.2M unique visitors a month), followed by YouTube (564.3M), Facebook (346.8M), and ChatGPT (300.4M). ChatGPT now reaches more people than Instagram, WhatsApp, Reddit, or Amazon.
By category, AI assistants, gaming, music, and creative software grew in September. News sites fell hardest (-4.24%), and all seven search engines in the top 100 lost traffic. Overall, 59 of the top 100 sites declined month over month.
Visits vs. Unique Visitors, in Plain English
A visit is one session on a website. A unique visitor is one person (technically, one device or browser) no matter how many times they come back that month.
So visits measure habit, and unique visitors measure reach. Divide one by the other and you get a number we’ll call visits per person, which tells you what kind of relationship people have with a site. A high number means a daily habit. A low number means people show up, get one thing done, and leave.
Neither is better. But if you want to know how many actual human beings a platform can put you in front of, unique visitors is the number you want.

Why Similarweb and Statista Count People, Not Just Visits
Most “most visited websites” lists, including Semrush’s public Top Websites page, rank sites by total visits and stop there. That’s a useful measure of activity. It’s a poor measure of popularity, because a small group of heavy users can make a site look far bigger than it is.
The data behind this post is different. Similarweb reports unique visitors alongside visits for every site, and Statista publishes a separate ranking of the world’s top websites by unique visitors, not just by traffic. Both answer the question most people are really asking when they say a site is “big”: how many different people use it each month?
The difference matters. Here’s how a visits-only ranking flatters sites with small, loyal audiences, and undersells sites that huge numbers of people use now and then:
| Website | Rank by visits | Rank by people | Unique visitors | Visits per person |
|---|---|---|---|---|
| bing.com | #5 | #18 | 125.4M | 26.2 |
| x.com | #8 | #19 | 121.0M | 17.1 |
| bilibili.com | #18 | #52 | 35.51M | 33.5 |
| naver.com | #27 | #78 | 19.69M | 37.7 |
| duckduckgo.com | #45 | #91 | 14.00M | 22.3 |
| microsoft.com | #26 | #6 | 259.6M | 3.0 |
| wikipedia.org | #17 | #7 | 215.7M | 5.7 |
| apple.com | #53 | #20 | 119.0M | 2.3 |
| paypal.com | #77 | #31 | 70.99M | 2.5 |
Red: ranks lower once you count people. Green: ranks higher. Source: Similarweb, September 2026.
By visits alone, Bing looks like the fifth-biggest site in the world. Count people and it’s 18th. Its reputation is built on 125.4 million loyal users searching 26 times a month each, not on reach. Naver looks like a top-30 global site by visits; by people it’s #78. Meanwhile Microsoft.com, Wikipedia, Apple, and PayPal each reach tens or hundreds of millions more people than their visit rankings suggest.
In other words, visit counts inflate the reputation of sites people use obsessively and hide the reach of sites people use briefly. If you’re deciding where to advertise, where to build a presence, or which platforms your customers actually use, monthly unique visitors is the more honest number. That’s why this list is ranked by people.
The Top 25 Websites by Unique Users in 2026

| Rank by people | Website | Unique visitors | Monthly visits | Visits per person | Rank by visits | Places gained |
|---|---|---|---|---|---|---|
| 1 | google.com | 761.2M | 33.79B | 44.4 | #1 | – |
| 2 | youtube.com | 564.3M | 23.08B | 40.9 | #2 | – |
| 3 | facebook.com | 346.8M | 5.38B | 15.5 | #3 | – |
| 4 | chatgpt.com | 300.4M | 4.10B | 13.6 | #4 | – |
| 5 | instagram.com | 273.5M | 3.17B | 11.6 | #6 | +1 |
| 6 | microsoft.com | 259.6M | 776.0M | 3.0 | #26 | +20 |
| 7 | wikipedia.org | 215.7M | 1.24B | 5.7 | #17 | +10 |
| 8 | whatsapp.com | 197.8M | 2.93B | 14.8 | #7 | -1 |
| 9 | reddit.com | 180.7M | 2.01B | 11.1 | #9 | – |
| 10 | amazon.com | 177.4M | 1.39B | 7.8 | #12 | +2 |
| 11 | gemini.google.com | 176.4M | 1.99B | 11.3 | #10 | -1 |
| 12 | linkedin.com | 153.8M | 1.37B | 8.9 | #13 | +1 |
| 13 | tiktok.com | 150.6M | 989.7M | 6.6 | #20 | +7 |
| 14 | live.com | 145.1M | 955.0M | 6.6 | #21 | +7 |
| 15 | pinterest.com | 131.0M | 849.8M | 6.5 | #24 | +9 |
| 16 | yahoo.com | 128.6M | 1.66B | 12.9 | #11 | -5 |
| 17 | canva.com | 128.3M | 708.2M | 5.5 | #28 | +11 |
| 18 | bing.com | 125.4M | 3.28B | 26.2 | #5 | -13 |
| 19 | x.com | 121.0M | 2.07B | 17.1 | #8 | -11 |
| 20 | apple.com | 119.0M | 269.6M | 2.3 | #53 | +33 |
| 21 | adobe.com | 118.0M | 264.0M | 2.2 | #54 | +33 |
| 22 | netflix.com | 113.3M | 1.35B | 11.9 | #14 | -8 |
| 23 | cloud.microsoft | 108.6M | 1.30B | 12.0 | #16 | -7 |
| 24 | zoom.us | 86.67M | 395.9M | 4.6 | #34 | +10 |
| 25 | claude.ai | 84.92M | 853.1M | 10.0 | #23 | -2 |
Source: Similarweb, September 2026, top 100 domains by traffic share. “Places gained” compares each site’s rank by unique visitors with its rank by total visits. Scroll sideways on mobile to see all columns. The full top 100 is at the bottom of this post.
The top four don’t change whichever way you count. Google and YouTube are so far ahead that no methodology dethrones them, and Statista’s February 2026 data puts them first and second by unique visitors too. Between them, those two domains account for 30.8% of all traffic across the 10,000 sites in Similarweb’s ranking.
It’s what happens just below the top that gets interesting.
Microsoft.com: The Biggest Site Nobody “Visits”
Microsoft.com drew 259.6 million unique visitors, the sixth-largest audience on the web. Yet those people averaged only 3 visits each, so by visit count it sits at #26. It’s the web’s front desk: people come for a download, an account page, or a support article, then leave.
Wikipedia, Canva, and Pinterest Climb
Wikipedia moves from #17 by visits to #7 by people (215.7M). Canva jumps 11 places to #17 (128.3M), and Pinterest gains 9 to reach #15 (131.0M). All three are “come when you need it” sites with huge reach and moderate frequency.
Bing and X Fall Hard
Bing is #5 by visits but #18 by people. Its 125.4M users average 26.2 visits each, one of the highest rates on the list, so a smaller, very loyal audience drives outsized traffic. X drops from #8 to #19 for the same reason: 121.0M people visiting 17.1 times a month.
Habit vs. Reach: How Often People Come Back
Here’s the visits-per-person number for a range of major sites. Across the full top 100, the median is about 10 visits per person per month.
Monthly visits divided by monthly unique visitors. Source: Similarweb, September 2026.
Roughly, sites fall into three groups:
- Daily habits (20+ visits per person). Google (44.4), YouTube (40.9), and Bing (26.2). Search engines dominate this group, along with Naver (37.7), Bilibili (33.5), and Twitch (23.9).
- Regular check-ins (8 to 17). Social networks and AI assistants: Facebook (15.5), WhatsApp (14.8), ChatGPT (13.6), Instagram (11.6), Gemini (11.3), Reddit (11.1), and Claude (10.0).
- Errand sites (under 4). Adblock Plus (1.8), Adobe (2.2), Apple (2.3), PayPal (2.6), Microsoft (3.0), Booking.com (3.1), and Etsy (3.2). Huge reach, and people leave the moment the job is done.
Keep that third group in mind. We’ll come back to it, because most small business websites belong there.
The Biggest Movers When You Count People Instead of Visits
Re-ranking the top 100 by unique visitors reshuffles the list more than you’d expect. The sites that gain the most are all errand sites:
- Adblock Plus: #97 by visits to #28 by people (+69). Its 80.3M users show up less than twice a month, mostly when the browser extension sends them there.
- PayPal: #77 to #31 (+46), with 71.0M people.
- Etsy: #80 to #40 (+40), with 51.7M people.
- Chase: #95 to #56 (+39).
- Apple and Adobe: #53 and #54 to #20 and #21 (+33 each), each reaching about 118 to 119 million people.
- Booking.com: #55 to #26 (+29), with 84.1M people.
The biggest drops go to sites with small but intensely loyal audiences. Naver, South Korea’s dominant search engine, falls from #27 to #78: its 19.7M users visit nearly 38 times a month. DuckDuckGo falls from #45 to #91 (14.0M people, 22.3 visits each), and Bilibili drops from #18 to #52.
Which Categories Grew and Which Declined
To see the bigger picture, we grouped all 100 sites into 11 categories and compared September traffic with August. The table also shows each category’s share of the top 100’s combined audience and combined visits, which reveals how differently people use each part of the web.
| Category | Sites | Share of people | Share of visits | Visits per person | Traffic change (MoM) |
|---|---|---|---|---|---|
| Gaming | 5 | 2.3% | 1.7% | 11.6 | +1.89% |
| Music | 2 | 1.3% | 0.6% | 7.5 | +1.73% |
| Other (reference, travel, jobs, education, adult, fan) | 7 | 6.3% | 2.2% | 5.3 | +1.63% |
| AI assistants | 7 | 8.5% | 6.6% | 12.0 | +1.28% |
| Work & productivity software | 15 | 17.5% | 5.7% | 5.1 | +0.95% |
| Shopping & marketplaces | 13 | 7.8% | 3.3% | 6.5 | +0.07% |
| Video streaming | 13 | 12.9% | 23.4% | 28.0 | +0.04% |
| Finance | 3 | 1.5% | 0.4% | 4.3 | -0.70% |
| Social & messaging | 16 | 22.8% | 17.6% | 11.9 | -0.85% |
| Search engines | 7 | 13.6% | 34.2% | 38.9 | -1.38% |
| News & portals | 10 | 4.8% | 3.7% | 11.9 | -4.24% |
Traffic change is the combined month-over-month change in visits for every site in the category, weighted by size. “Share of people” adds up each site’s unique visitors, so people who use several sites in a category are counted more than once. Social excludes vk.com and vk.ru (explained in trend #10 below). Categories are our own groupings of each site’s listed industry.
The Categories That Grew
Gaming (+1.89%) had the best month of any category, powered by Steam (+10.13%) and Twitch (+6.33%), which more than offset Roblox (−6.12%).
Music (+1.73%) grew on both of its sites, YouTube Music (+2.14%) and Spotify (+1.28%).
Reference, travel, jobs, and education (+1.63%) was lifted almost entirely by Instructure, the company behind the Canvas learning platform (+54.81%).
AI assistants (+1.28%) added about 99 million visits, more net growth in raw visits than any other category. Nearly all of it came from ChatGPT.
Work and productivity software (+0.95%) grew thanks to Adobe (+16.64%), cloud.microsoft (+7.19%), Apple (+4.96%), and Canva (+4.39%). This category is also the clearest example of reach without habit: it holds 17.5% of the top 100’s audience but only 5.7% of its visits.
Video streaming (+0.04%) and shopping (+0.07%) were essentially flat overall, but both hide big swings between individual brands, covered in the trends below.
The Categories That Declined
News and portals (-4.24%) had the worst month. Nine of its ten sites lost traffic, led by BBC (−21.90%), MSN (−7.00%), AOL (−6.74%), and Yahoo (−4.67%). The New York Times (+0.21%) was the only one to grow.
Search engines (-1.38%) lost about 567 million visits, the largest raw drop of any category. Search is still the web’s biggest habit, with 34.2% of all visits in the top 100 from just 13.6% of its audience.
Social and messaging (-0.85%) dipped as Reddit, Facebook, and WhatsApp slipped, even though several smaller apps grew. Social still holds the largest share of people in the top 100, at 22.8%.
Finance (-0.70%) edged down, with Chase (−3.09%) and PayPal (−0.51%) slightly lower and TradingView (+1.14%) slightly higher.
10 Trends Hiding in the September 2026 Data
One month of data isn’t a long-term trend on its own, so treat these as signals worth watching rather than conclusions.
1. ChatGPT Is Pulling Away From Its AI Rivals
ChatGPT grew +3.92% in September while Gemini (−2.49%), Claude (−2.35%), and Grok (−0.78%) all lost traffic. ChatGPT now accounts for 46% of the unique visitors and 52% of the visits across the seven AI sites in the top 100.
The exception is China. DeepSeek’s main site (+4.57%) jumped four places, and ByteDance’s Doubao grew +3.26%.
2. Every Major Search Engine Lost Traffic
All seven search engines in the top 100 declined: Google (−1.22%), Bing (−1.19%), Yandex (−3.83%), Baidu (−2.80%), Naver (−2.09%), DuckDuckGo (−2.67%), and Ya.ru (−3.30%). Meanwhile AI assistants gained visits.
Nobody should read that as “search is dying.” Google still gets more than 33 billion visits a month, and its users come back 44 times each. But it lines up with what we covered in what works in SEO today in the age of AI: more questions are being answered without a traditional search, or without a click.
3. News Sites Had the Worst Month of Any Category
News and portals fell -4.24%, and BBC’s −21.90% drop cost it two places in the rankings. Portals built on general news and headlines (MSN, AOL, Yahoo, Google News) all declined together, which points to a category-wide squeeze rather than one brand’s bad month.
4. Microsoft Is Moving Its Own Traffic
cloud.microsoft grew +7.19% and gained a place, while office.com fell −7.54% and live.com dipped −1.90%. That pattern is consistent with Microsoft consolidating its Microsoft 365 apps onto the newer cloud.microsoft domain. It’s a reminder that one company’s internal URL changes can look like a user trend in the data.
5. Back-to-School Shows Up in the Numbers
Instructure, home of the Canvas learning platform used by many schools and universities, grew +54.81% and climbed three places in a single month. September is when classes resume across much of the Northern Hemisphere, and it’s one of the clearest seasonal signals in the dataset.
6. Creative Tools Are Up, Quick Utilities Are Down
Adobe had the biggest gain of any household-name brand in the top 100 (+16.64%), and Canva grew +4.39%. On the other side, single-task utilities slipped: iLovePDF fell −6.05% and Adblock Plus fell −16.13%. One month can’t tell us why, but it’s worth watching whether AI assistants are absorbing simple jobs like converting a PDF.
7. The Streaming Shakeout Continues
Streaming was flat as a category, but individual services went in opposite directions. Disney+ (+14.03%), Prime Video (+4.13%), and Netflix (+1.92%) all grew. Peacock (−47.65%) fell 16 places, and Hotstar (−8.04%), Crunchyroll (−7.85%), and HBO Max (−3.90%) also declined. Streaming traffic tends to follow specific shows and live events, so big swings like Peacock’s often reverse.
8. Smaller Social Apps Grew While the Giants Slipped
Reddit (−3.36%), Facebook (−1.77%), WhatsApp (−1.12%), and X (−0.45%) all lost traffic. Messenger (+6.04%), Pinterest (+3.16%), Threads (+2.26%), and TikTok (+0.86%) grew. Reddit’s dip is worth noting because its threads show up so often in Google results and AI answers.
9. Cross-Border Shopping Beat the Big-Box Sites
AliExpress grew +5.98%, and Amazon’s German (+3.80%) and UK (+3.65%) storefronts both gained, as did Etsy (+3.17%). Walmart (−0.49%), eBay (−0.30%), and Temu (−1.14%) slipped, and Russia’s Wildberries dropped −14.84%. Amazon.com itself was steady at +0.38%.
10. Domain Changes Can Fake a Trend
The two most extreme numbers in the dataset belong to the same company. vk.ru, the newer domain of Russia’s largest social network, grew +87.34%, while vk.com fell −98.52%. That looks far more like traffic being moved (or reclassified) from one domain to another than a real surge and collapse, so we left both out of the category math. Before reacting to a dramatic spike in anyone’s traffic, including a competitor’s, check whether a domain moved.
AI Chatbots Now Reach More People Than Most Social Networks
This is the stat business owners should sit with for a minute. ChatGPT reached 300.4 million unique visitors in September 2026. That makes it the fourth-largest audience on the web, ahead of Instagram (273.5M), WhatsApp (197.8M), Reddit (180.7M), and Amazon (177.4M).
| AI assistant | Unique visitors | Visits per person | Rank by people |
|---|---|---|---|
| chatgpt.com | 300.4M | 13.6 | #4 |
| gemini.google.com | 176.4M | 11.3 | #11 |
| claude.ai | 84.92M | 10.0 | #25 |
| chat.deepseek.com | 26.53M | 10.2 | #64 |
| grok.com | 20.52M | 8.1 | #74 |
Sites in the “AI Chatbots and Tools” category within the top 100, September 2026.
Together, these five assistants logged more than 600 million unique visits in a month (people who use more than one get counted more than once, so the true number of individuals is lower). And people come back to them about as often as they come back to Instagram or Reddit. ChatGPT’s 13.6 visits per person is higher than both.
Those are people asking for recommendations: which dentist, which contractor, which accountant. If an AI assistant doesn’t know your business exists, you’re invisible to an audience the size of Facebook’s.
The Seattle Angle: Two Local Companies Own 15 of the Top 100
Here’s a stat we couldn’t resist. Fifteen of the world’s 100 highest-traffic domains belong to two companies headquartered within 20 miles of each other.
Microsoft (Redmond) owns eight: microsoft.com (#6 by people), LinkedIn (#12), live.com (#14), Bing (#18), cloud.microsoft (#23), GitHub (#27), office.com (#29), and MSN (#47). Together they account for 4.8% of all traffic across Similarweb’s 10,000-domain ranking, more than Facebook’s 2.9%.
Amazon (Seattle) owns seven: amazon.com (#10), IMDb (#30), Prime Video (#45), Twitch (#46), and its Germany, UK, and Japan storefronts.
Why Every Source Gives You Different Numbers
If you compare traffic sources side by side, the absolute numbers rarely match, and sometimes they’re not even close:
- Semrush’s public Top Websites page credits google.com with 105.72 billion visits in August 2026.
- Statista reports about 5.64 billion unique visitors to Google.com in February 2026, and about 2.85 billion for YouTube.
- Similarweb’s September 2026 data, which this post is built on, shows google.com at 33.79 billion visits and 761.2 million unique visitors.
These aren’t mistakes. Every provider estimates traffic from a different panel of users, counts different things (people vs. devices vs. browser cookies), and handles mobile apps and subdomains differently. The practical lesson: trust the rankings and ratios, not the raw totals. Every source agrees that Google and YouTube lead and that ChatGPT has crashed the top five. The exact count is an estimate either way.
The same applies to your own analytics. When Google Analytics reports “users,” it’s counting browsers and devices, not people. A customer who checks your site on their phone and later on their work laptop counts twice.
What This Means for Your Small Business Website
You’re not competing with Google for traffic. But the gap between visits and unique visitors, and the shifts between categories, carry some very practical lessons.
1. Find Your Own Visits-Per-Person Number
In Google Analytics 4, open Reports → Acquisition → Traffic acquisition. Divide Sessions by Total users for the last 30 days. Most local service businesses will land much closer to Microsoft.com (around 3) than to Google (44). That’s normal. Nobody visits their dentist’s website every day.
2. If You’re an Errand Site, Design for the One Visit
PayPal, Booking.com, and Apple reach enormous audiences who arrive, finish a task, and leave. Your site probably works the same way, so every page needs to close the loop on the first try. Your phone number, service area, hours, and a booking or quote button should be visible without scrolling, on mobile especially. You may not get a second visit.
3. Go Where the People Already Are
The three biggest audiences on the web are Google (761.2M people), YouTube (564.3M), and Facebook (346.8M). For a local business, that means a complete, active Google Business Profile, a handful of short YouTube videos answering the questions customers ask you on the phone, and a Facebook page that’s current. None of those require new website traffic. They borrow reach from platforms that already have it.
4. Don’t Write Off Bing
Bing reaches 125.4 million people who search 26 times a month each, one of the most engaged audiences anywhere. Bing also powers Microsoft’s Copilot assistant. Claiming your free Bing Places listing and verifying your site in Bing Webmaster Tools takes under an hour, and most of your competitors haven’t done it.
5. Plan for Search to Share the Stage
Every search engine in the top 100 lost traffic in September while AI assistants grew. Google will stay your most important channel for the foreseeable future, but it’s no longer the only place customers look for answers. Track branded searches, phone calls, and form fills alongside rankings, so you can see demand that doesn’t arrive as a click.
6. Get Findable in AI Answers
ChatGPT, Gemini, and Claude alone reach more than 560 million unique visitors a month. When those people ask “who’s the best family dentist in Ballard?”, the assistant builds its answer from sources it can find and trust: your website, your reviews, directory listings, and discussions on sites like Reddit (#9 by people) and Wikipedia (#7). Clear service pages, consistent business details everywhere, and genuine reviews are what get a local business named in those answers.
Find Out If AI Assistants Can See Your Business
Hundreds of millions of people now ask ChatGPT, Gemini, and Claude for recommendations every month. Our free AI visibility audit shows whether those assistants mention your business, what they say about you, and the specific fixes that would get you named. No cost and no obligation, from a Seattle team that does this every day.
Get my free AI visibility audit
Or call (206) 210-3398 · email hello@seattleorganicseo.com
Frequently Asked Questions
What Website Has the Most Unique Users in 2026?
Google.com, with 761.2 million unique visitors in September 2026, followed by YouTube.com (564.3M) and Facebook.com (346.8M). Statista’s February 2026 data also ranks Google first and YouTube second by unique visitors, though its absolute counts are much higher because it uses a different measurement method.
What’s the Difference Between Visits and Unique Visitors?
A visit is one session on a site. A unique visitor is one person (or device) counted once per month, however many times they return. Visits measure habit; unique visitors measure reach.
How Many People Use ChatGPT’s Website Each Month?
About 300.4 million unique visitors in September 2026, the fourth-largest audience of any website, ahead of Instagram, WhatsApp, Reddit, and Amazon. Those users averaged 13.6 visits each.
Which Types of Websites Are Growing in 2026?
In September 2026, gaming, music, AI assistants, and work and creative software grew month over month among the top 100 sites. News portals declined the most, followed by search engines and social networks.
Which Popular Site Gains the Most When Ranked by People Instead of Visits?
Among well-known brands, PayPal climbs the furthest, from #77 by visits to #31 by unique visitors. Microsoft.com makes the biggest jump into the top 10, from #26 to #6.
The Full List: Top 100 Websites by Unique Users
| Rank by people | Website | Unique visitors | Monthly visits | Visits per person | Rank by visits | Places gained |
|---|---|---|---|---|---|---|
| 1 | google.com | 761.2M | 33.79B | 44.4 | #1 | – |
| 2 | youtube.com | 564.3M | 23.08B | 40.9 | #2 | – |
| 3 | facebook.com | 346.8M | 5.38B | 15.5 | #3 | – |
| 4 | chatgpt.com | 300.4M | 4.10B | 13.6 | #4 | – |
| 5 | instagram.com | 273.5M | 3.17B | 11.6 | #6 | +1 |
| 6 | microsoft.com | 259.6M | 776.0M | 3.0 | #26 | +20 |
| 7 | wikipedia.org | 215.7M | 1.24B | 5.7 | #17 | +10 |
| 8 | whatsapp.com | 197.8M | 2.93B | 14.8 | #7 | -1 |
| 9 | reddit.com | 180.7M | 2.01B | 11.1 | #9 | – |
| 10 | amazon.com | 177.4M | 1.39B | 7.8 | #12 | +2 |
| 11 | gemini.google.com | 176.4M | 1.99B | 11.3 | #10 | -1 |
| 12 | linkedin.com | 153.8M | 1.37B | 8.9 | #13 | +1 |
| 13 | tiktok.com | 150.6M | 989.7M | 6.6 | #20 | +7 |
| 14 | live.com | 145.1M | 955.0M | 6.6 | #21 | +7 |
| 15 | pinterest.com | 131.0M | 849.8M | 6.5 | #24 | +9 |
| 16 | yahoo.com | 128.6M | 1.66B | 12.9 | #11 | -5 |
| 17 | canva.com | 128.3M | 708.2M | 5.5 | #28 | +11 |
| 18 | bing.com | 125.4M | 3.28B | 26.2 | #5 | -13 |
| 19 | x.com | 121.0M | 2.07B | 17.1 | #8 | -11 |
| 20 | apple.com | 119.0M | 269.6M | 2.3 | #53 | +33 |
| 21 | adobe.com | 118.0M | 264.0M | 2.2 | #54 | +33 |
| 22 | netflix.com | 113.3M | 1.35B | 11.9 | #14 | -8 |
| 23 | cloud.microsoft | 108.6M | 1.30B | 12.0 | #16 | -7 |
| 24 | zoom.us | 86.67M | 395.9M | 4.6 | #34 | +10 |
| 25 | claude.ai | 84.92M | 853.1M | 10.0 | #23 | -2 |
| 26 | booking.com | 84.06M | 256.6M | 3.1 | #55 | +29 |
| 27 | github.com | 81.49M | 507.6M | 6.2 | #31 | +4 |
| 28 | adblockplus.org | 80.31M | 146.9M | 1.8 | #97 | +69 |
| 29 | office.com | 79.53M | 330.9M | 4.2 | #41 | +12 |
| 30 | imdb.com | 75.20M | 247.1M | 3.3 | #58 | +28 |
| 31 | paypal.com | 70.99M | 180.7M | 2.5 | #77 | +46 |
| 32 | ilovepdf.com | 66.97M | 224.6M | 3.4 | #63 | +31 |
| 33 | spotify.com | 65.09M | 362.2M | 5.6 | #36 | +3 |
| 34 | aliexpress.com | 64.63M | 249.9M | 3.9 | #56 | +22 |
| 35 | ebay.com | 62.10M | 333.3M | 5.4 | #40 | +5 |
| 36 | fandom.com | 59.91M | 336.0M | 5.6 | #39 | +3 |
| 37 | steampowered.com | 57.56M | 183.0M | 3.2 | #75 | +38 |
| 38 | discord.com | 53.68M | 530.9M | 9.9 | #29 | -9 |
| 39 | yandex.ru | 52.53M | 1.33B | 25.4 | #15 | -24 |
| 40 | etsy.com | 51.73M | 167.6M | 3.2 | #80 | +40 |
| 41 | indeed.com | 51.45M | 212.9M | 4.1 | #65 | +24 |
| 42 | walmart.com | 50.76M | 184.4M | 3.6 | #73 | +31 |
| 43 | baidu.com | 48.00M | 827.4M | 17.2 | #25 | -18 |
| 44 | temu.com | 47.95M | 205.6M | 4.3 | #67 | +23 |
| 45 | primevideo.com | 46.89M | 225.6M | 4.8 | #61 | +16 |
| 46 | twitch.tv | 41.62M | 996.1M | 23.9 | #19 | -27 |
| 47 | msn.com | 40.42M | 327.3M | 8.1 | #42 | -5 |
| 48 | nytimes.com | 40.04M | 225.2M | 5.6 | #62 | +14 |
| 49 | music.youtube.com | 36.04M | 398.1M | 11.0 | #33 | -16 |
| 50 | pornhub.com | 35.79M | 188.7M | 5.3 | #72 | +22 |
| 51 | disneyplus.com | 35.72M | 304.0M | 8.5 | #46 | -5 |
| 52 | bilibili.com | 35.51M | 1.19B | 33.5 | #18 | -34 |
| 53 | steamcommunity.com | 34.75M | 154.9M | 4.5 | #87 | +34 |
| 54 | yahoo.co.jp | 34.70M | 859.7M | 24.8 | #22 | -32 |
| 55 | qq.com | 33.56M | 244.1M | 7.3 | #59 | +4 |
| 56 | chase.com | 31.77M | 148.1M | 4.7 | #95 | +39 |
| 57 | threads.com | 31.61M | 157.8M | 5.0 | #86 | +29 |
| 58 | espn.com | 31.12M | 206.0M | 6.6 | #66 | +8 |
| 59 | mail.ru | 30.57M | 401.1M | 13.1 | #32 | -27 |
| 60 | deepseek.com | 28.93M | 296.3M | 10.2 | #48 | -12 |
| 61 | hbomax.com | 28.69M | 275.8M | 9.6 | #51 | -10 |
| 62 | roblox.com | 27.81M | 520.0M | 18.7 | #30 | -32 |
| 63 | vk.ru | 27.78M | 353.6M | 12.7 | #37 | -26 |
| 64 | chat.deepseek.com | 26.53M | 270.7M | 10.2 | #52 | -12 |
| 65 | amazon.de | 26.05M | 204.1M | 7.8 | #68 | +3 |
| 66 | vk.com | 25.53M | 323.5M | 12.7 | #43 | -23 |
| 67 | xhamster.com | 25.49M | 158.1M | 6.2 | #85 | +18 |
| 68 | telegram.org | 25.24M | 300.3M | 11.9 | #47 | -21 |
| 69 | ozon.ru | 23.27M | 316.7M | 13.6 | #44 | -25 |
| 70 | amazon.co.uk | 23.08M | 159.7M | 6.9 | #83 | +13 |
| 71 | amazon.co.jp | 22.62M | 236.8M | 10.5 | #60 | -11 |
| 72 | ya.ru | 21.36M | 248.2M | 11.6 | #57 | -15 |
| 73 | zhihu.com | 20.64M | 152.3M | 7.4 | #92 | +19 |
| 74 | grok.com | 20.52M | 167.2M | 8.1 | #81 | +7 |
| 75 | dzen.ru | 20.40M | 351.1M | 17.2 | #38 | -37 |
| 76 | news.yahoo.co.jp | 20.28M | 380.9M | 18.8 | #35 | -41 |
| 77 | bbc.co.uk | 20.05M | 202.1M | 10.1 | #69 | -8 |
| 78 | naver.com | 19.69M | 741.5M | 37.7 | #27 | -51 |
| 79 | vkvideo.ru | 19.41M | 184.2M | 9.5 | #74 | -5 |
| 80 | mercadolivre.com.br | 18.53M | 146.5M | 7.9 | #99 | +19 |
| 81 | notion.com | 18.25M | 152.5M | 8.4 | #91 | +10 |
| 82 | douyin.com | 17.60M | 279.5M | 15.9 | #50 | -32 |
| 83 | rutube.ru | 16.65M | 160.1M | 9.6 | #82 | -1 |
| 84 | avito.ru | 16.52M | 172.3M | 10.4 | #79 | -5 |
| 85 | ok.ru | 16.41M | 172.4M | 10.5 | #78 | -7 |
| 86 | tradingview.com | 15.91M | 181.7M | 11.4 | #76 | -10 |
| 87 | messenger.com | 15.75M | 282.0M | 17.9 | #49 | -38 |
| 88 | wildberries.ru | 15.03M | 148.8M | 9.9 | #94 | +6 |
| 89 | crunchyroll.com | 14.41M | 159.1M | 11.0 | #84 | -5 |
| 90 | doubao.com | 14.14M | 146.8M | 10.4 | #98 | +8 |
| 91 | duckduckgo.com | 14.00M | 312.3M | 22.3 | #45 | -46 |
| 92 | hotstar.com | 12.75M | 147.9M | 11.6 | #96 | +4 |
| 93 | instructure.com | 12.43M | 192.3M | 15.5 | #70 | -23 |
| 94 | brave.com | 12.02M | 222.9M | 18.5 | #64 | -30 |
| 95 | chess.com | 11.69M | 153.8M | 13.2 | #89 | -6 |
| 96 | news.google.com | 11.48M | 150.6M | 13.1 | #93 | -3 |
| 97 | max.ru | 11.13M | 188.7M | 17.0 | #71 | -26 |
| 98 | peacocktv.com | 10.58M | 152.6M | 14.4 | #90 | -8 |
| 99 | aol.com | 8.56M | 146.3M | 17.1 | #100 | +1 |
| 100 | atlassian.net | 7.42M | 154.0M | 20.7 | #88 | -12 |
Methodology: We took the 100 highest-traffic domains from Similarweb’s September 2026 ranking of 10,000 domains and re-sorted them by monthly unique visitors. “Visits per person” is monthly visits divided by unique visitors. Category growth rates are size-weighted month-over-month changes in visits, using our own groupings of each site’s listed industry. Sites that rank outside the top 100 by visits but might reach more people than some sites on this list aren’t included, so treat ranks near the bottom as approximate. Cross-referenced with Semrush Top Websites (August 2026) and Statista (February 2026).

Written by
Brandon Na
Founder, Seattle Organic SEO · 20+ years in the search trenches
Brandon has led SEO hands-on for more than two decades. He started in digital before “SEO” was a job title, and he has been in the trenches through every major Google shift since, from early link-graph days to Panda and Penguin to today’s AI Overviews and AI Mode. His agency, Seattle Organic SEO, has held the #1 spot for “Seattle SEO” for most of a decade and a half. That is the same kind of result he builds for clients in auto, home services, education, fintech, and ecommerce.
His own content has drawn more than 35 million views across Quora, YouTube, and his blogs. He has also helped create more than $600 million in value for clients. He led SEO at Electriq Marketing and hosted the SEO 2day YouTube channel. Today he is also Managing General Partner at Good Peoples Ventures, host of the Startup Wins podcast, a published author, and a future Stanford LEAD program graduate.
He tests before he teaches. The data in this post comes from Similarweb’s September 2026 estimates for the web’s 100 largest domains, checked against Semrush and Statista and against what he sees on live client sites.
Full bio · LinkedIn · X · YouTube · brandon@seattleorganicseo.com
