
Latest 2022 Comscore Search Engine Market Data
Search Engine market share didn’t change a bit from May to June 2018, but perhaps your needs for a great SEO or PPC agency have?
Are you looking for an impressive Seattle SEO services company? How about a Seattle PPC Management Agency? We obviously know all the benefits of using SEM — we wrote the best guide on it! We also handle local search engine optimization for companies who really need a smart Local SEO agency. Contact us!
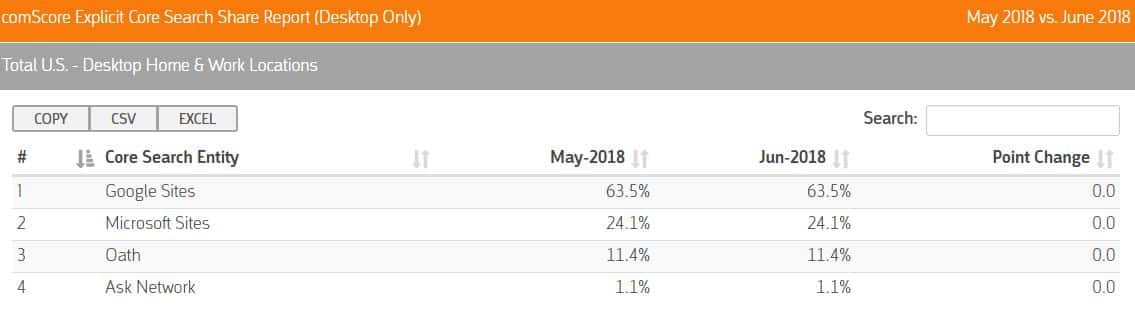
Google still owns 63.5% of the US Market share!
Bing is holding steady at at 24.1%.
Our latest “2019’s Most Searched Keywords on Google” is out. Check it out for the latest trends in what people are look for on the Internet!
Here’s the latest data by Comscore:
June 2018 Search Engine Market Share – Total U.S. – Desktop Home & Work Locations
Total Monthly Searches Conducted Monthly – June 2018

However, it appears that the number of searches decreased across the board.
How many searches are conducted monthly in the United States?
According to the latest comscore numbers and examining the top 4 search engines, it’s:
18,181,000,000 searches a month
That’s a -2.3% drop from the month before. However, it’s still 2.3% growth from April 2018.
This is just in the United States. In May of 2016, Google confirmed they conducted over 2 Trillion searches a year. That’s up from 1.2 trillion in 2012.
The article cleanly showed the trends as:
-
1999: one billion per year (based on three million searches per day in August 1999, as reported by John Battelle in his great book, The Search. The figures, I’m fairly certain, came directly from Google, which was more open back then when needing to prove its growth story)
-
2000: 14 billion (based on 18 million searches per day for the first half of 2000 and 60 million for the second half, from figures reported by Battelle. It’s not a perfect estimate, but it’s the best I can figure)
-
2001-2003: 55 billion+ (based on reports by Google for its Zeitgeist in 2001, 2002 and 2003)
-
2004-2008: 73 billion (based on Google saying it was doing 200 million searches per day in 2004. After that, it said only “billions†in Google Zeitgeist for 2005 and 2007, with nothing said for 2006 or 2008)
-
2009: 365 billion+ (A Google blog post in 2009 said Google was doing more than one billion searches per day, then silence for 2010 and 2011)
-
2012-2015: 1.2 trillion (based on a 100-billion-per-month figure Google released during a special press briefing on search in 2012. Google repeated this figure in 2015, when expressing it as three billion searches per day)
-
2016: two trillion+ (based on this story that you’re reading now!)
While Comscore is the larger organization, 2 other organizations also attempt to track this data and have more up to date metrics. The first includes:
July 2018 Search Market Share Estimates from NetMarketShare
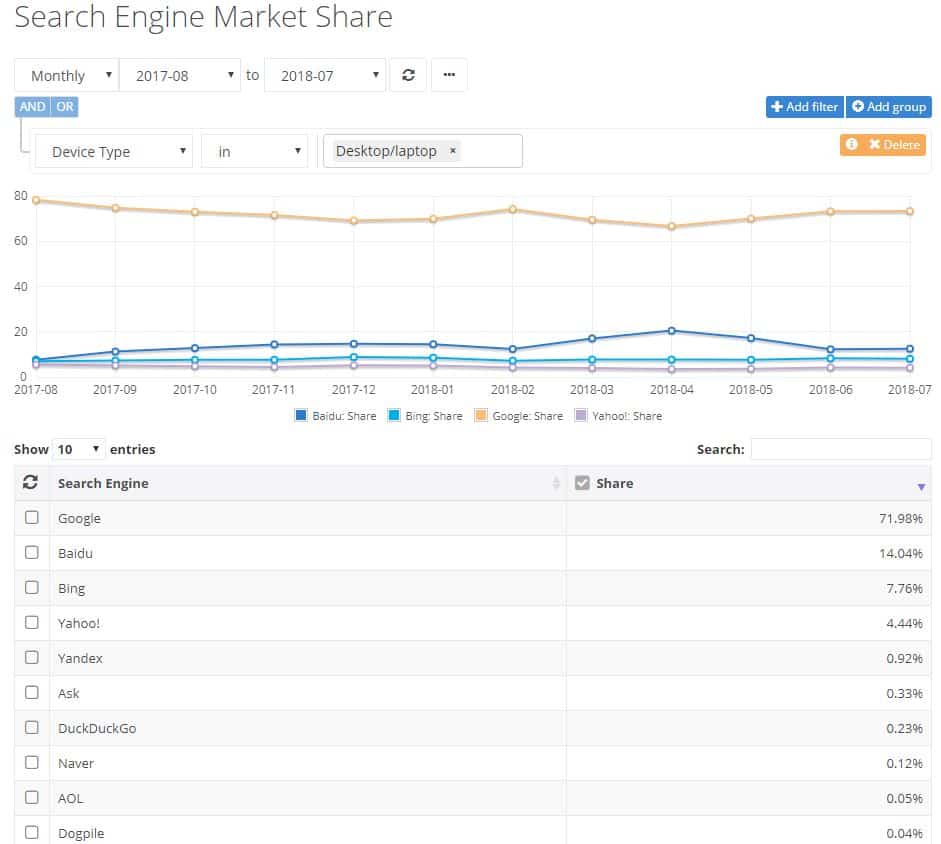
This examination is global. So, it includes Baidu which comes in at 14.04% of the global search engine market share due to the high numbers of Chinese. Bing’s market share decreases overall and Google’s dominance in other countries increases its market share throughout the world at close to 72%.
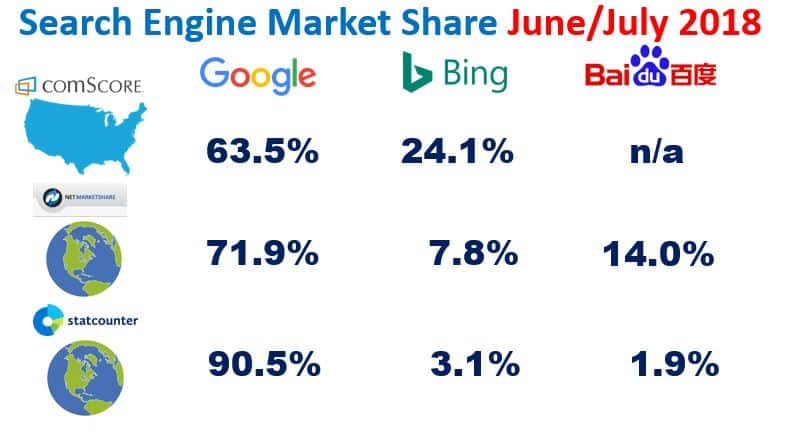
July 2018 Search Market Share Estimates from StatCounter

And StatCounter claims Google’s share at an even higher amount.
June/July 2018 Search Engine Market Share Summary
Lastly, in the ABC/Google Q2 2018 Earnings Call, Sundar Pichai, CEO Google said:
“Local mobile searches are growing faster than mobile searches for us. And they’ve increased by almost 50% in the last year alone.”